•Overlay Data command: chooses what types of information (such as water temperature) to show overlaid on the sonar chart screen.
•Sonar Features command: launches the Sonar Features menu which
controls many functions and options, including screen color mode, auto depth and sensitivity, surface clarity, noise rejection, Fish I.D. sym- bols, the zoom bar and zone bar.
•Ping Speed command: sets the rate at which sonar pings are made.
Pages
The Cuda 240 has three major Sonar display options. They are the Full Sonar Chart, Split Zoom Sonar Chart and Digital Data.
You access the various display modes by pressing the PAGES key. Press → to SONAR↑ or ↓ to desired pageENT.
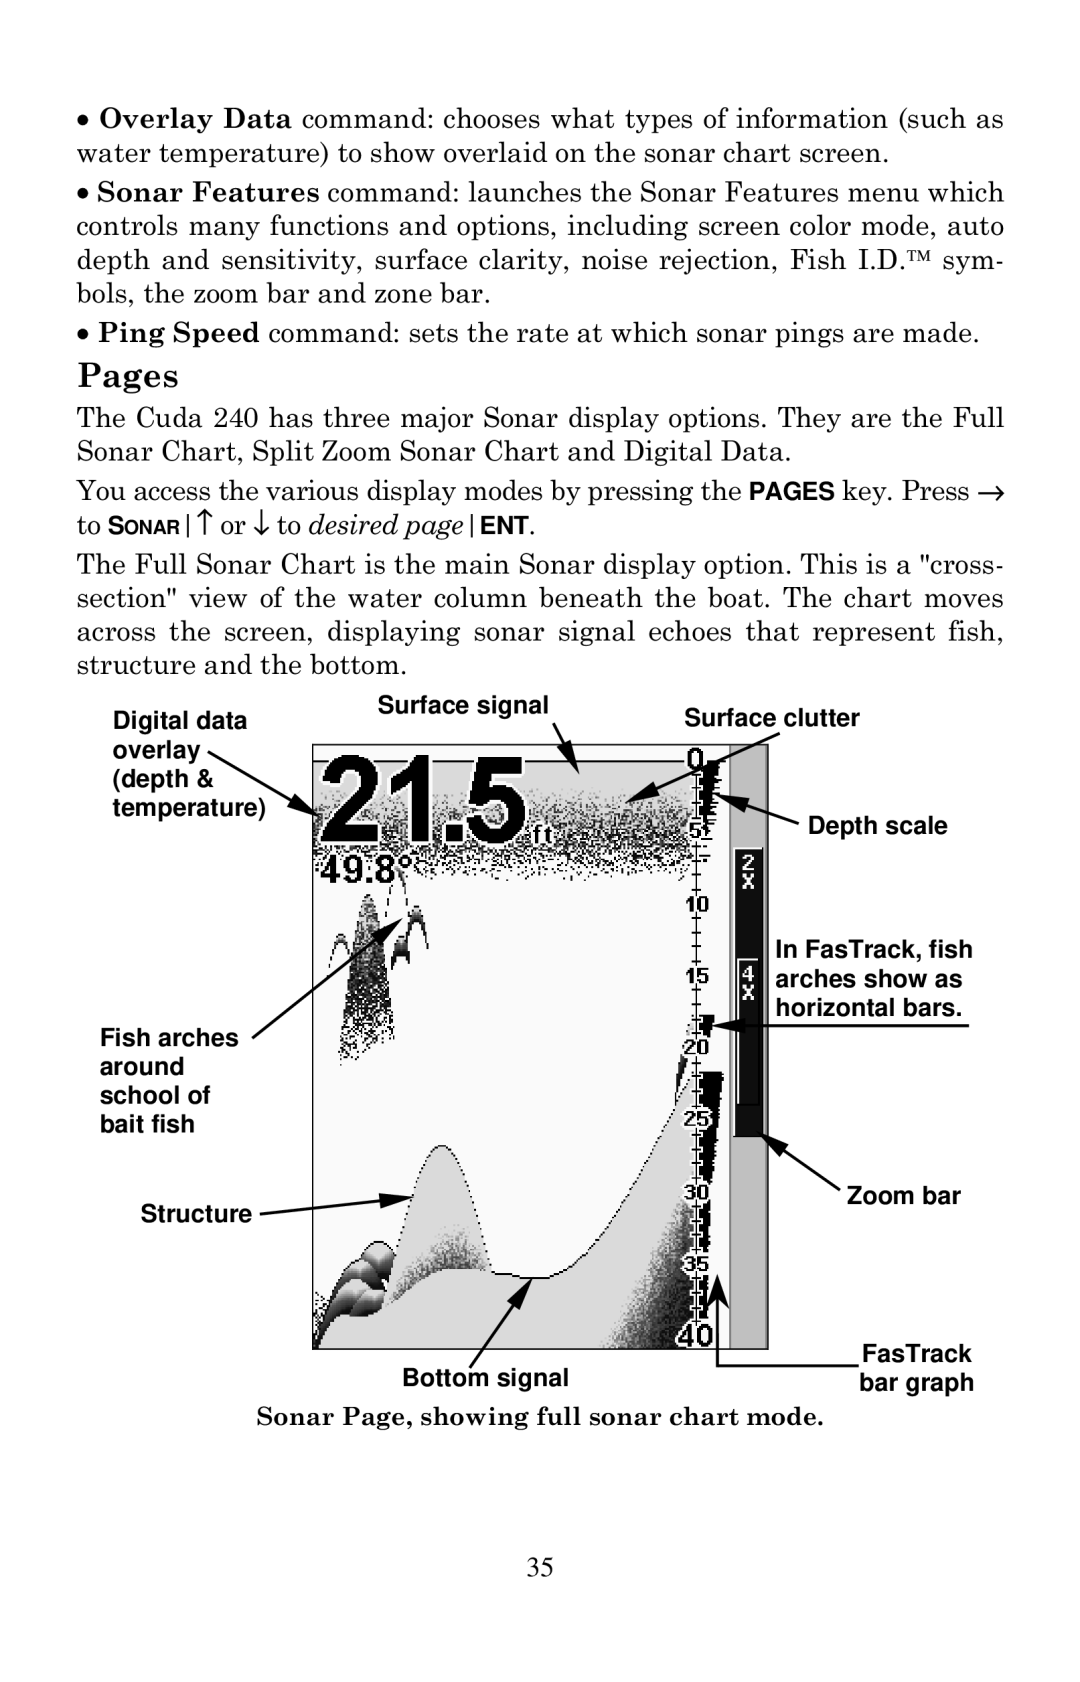
The Full Sonar Chart is the main Sonar display option. This is a "cross- section" view of the water column beneath the boat. The chart moves across the screen, displaying sonar signal echoes that represent fish, structure and the bottom.
Digital data | Surface signal | Surface clutter | |||
| |||||
overlay |
|
|
|
|
|
|
|
|
|
| |
(depth & |
|
|
|
|
|
temperature) |
|
|
| Depth scale | |
|
|
|
| ||
|
|
|
| In FasTrack, fish | |
|
|
|
| arches show as | |
|
|
|
| horizontal bars. | |
Fish arches |
|
|
|
|
|
around |
|
|
|
|
|
school of |
|
|
|
|
|
bait fish |
|
|
|
|
|
Structure |
|
|
| Zoom bar | |
|
|
|
|
| |
|
|
| FasTrack |
Bottom signal |
| ||
|
| bar graph |
Sonar Page, showing full sonar chart mode.
35