Color Scanning Sonar
00015742711
Important Notices
Safety Instructions
Iii
Replace anticorrosion zinc plate yearly
This page intentionally left blank
Table of Contents
Safety Instructions
Table of Contents
Vii
Viii
NUMERIC/GRAPHIC Data Display
MAINTENANCE, Troubleshooting
Foreword
Features
Word to the Owner of the Furuno FSV-84
Xii
System Configuration
Blackbox type configuration
System with locally supplied monitor
Xiii
System with Furuno monitor
Standard type configuration
Xiv
Control Description
Operational Overview
Control unit
Turning the Power On/Off
Turning the power on
Turning the power off
Power & Transducer controls
Lowering, Raising the Transducer
Screen Brilliance
Lowering the transducer
Raising the transducer
Control Panel Dimmer
Main menu default
Others menu
Display Setting menu
Dialog box for setting numeric value
Mode selection menus
Selecting a display mode
Display Mode, Display Division
Horizontal mode
Sample display mode pictures
Horizontal mode display
H2 mode
Horizontal 2 display
Slant mode, single display
Slant display single
Slant mode, combination display
Slant display combination
V1 + ES1 or ES2 mode
V1 and V2 modes
V1 and V2 displays
V1 & ES1 ES2 display
History mode
ES1 mode
History display
ES1 display
ES2 mode
ES1 + ES2 mode
ES2 display shown downward picture
ES1 + ES2 display
Adjusting the Gain
Menu Overview
Main menu
Scan Setting menu
Menu Title
Echo sounder picture advance speed dialog box
YES
This page intentionally left blank
Horizontal Mode
Basic Operating Procedure
Horizontal mode indications and marks
Horizontal mode
Indications and Marks
Horizontal2 mode
Dialog box for setting combination
Landscape
Left Inset
Display Range
Range concept
Setting the tilt angle
Tilt Angle
Automatic tilt range narrow with Auto Tilt key
Automatic tilt
Automatic tilt range wide with Auto Tilt key
Auto tilt concept
Relation between bottom echo and tilt angle
Case 1 Tilt angle 30 to
Case 2 Tilt angle 10 to
Case 3 Tilt angle 0 to
Tilt angle for surface fish
Tilt angle
Suitable tilt angle
Tilt angle and beam coverage
Measuring Range and Bearing to a Target
Location of trackball data
Eliminating Weak Echoes
Principle of TVG
Numeric data entry dialog box
Adjust AGC
Suppressing Bottom Tail
Adjust 2nd AGC
Decrease pulse length
Adjust Near AGC
Fish echo
Identifying noise source
Rejecting Sonar Interference and Noise
Interference rejector
Shifting Tx frequency
Changing Tx interval
How TX Interval works
Setting reference bearing for frequency change
Noise limiter
Echo average
Reverberation reduction
Sidelobe suppression
Adjusting Beamwidth
Tracking a Fish School target lock
Selecting target lock type
Target Lock menu
Target lock type dialog box
Fish school tracking mode
Target lock mark and target lock data
Position tracking mode
How position tracking mode target lock works
Target Lock menu
Selecting direction
Detecting Fish Schools Aurally
Range and audio bearing marks
Selecting audio sector
Alarm & Audio menu
Audio sector dialog box
Reverberation
Automatic training
Indications related to automatic training
Presentation Mode
Presentation mode description
Presentation modes
Automatic return of own ship mark in true motion
Display Setup menu
How to select a presentation mode
Presentation mode dialog box
Fish Alarm
Fish alarm status dialog box
How to set the fish alarm zone
How to create desired alarm zone
How to use offcenter
Relocating Fish School for Easy Observation
Comparing Fish School Concentration
Estimate marks and their data
Measuring Fish School Speed
How to measure fish school speed
Entering fish marks
Deleting fish marks
Fish mark
Deleting fish marks with the Delete Mark key
Deleting fish marks through the menu
Entering an event mark
Event Mark, Own Ship Position Mark
Event mark data
Deleting an event mark, own ship position mark
Entering an own ship position mark
Event mark description
Deleting event marks, own ship position mark from the menu
Inscribing the net course mark
Net Course Mark
Net course mark
Observing Net Behavior
Net behavior
PRESET, Memory Card menu
Storing, Recalling Picture
Storing the picture
Recalling stored picture
Others Menu
Displaying the Others menu
Color Setting menu
Others menu description
Color response curve
TVG setting window
Bottom echoes
Interpreting the Horizontal Display
Bottom echoes
Fish schools
Fish schools
Sea surface reflections
Wake
Sea surface reflections
Wake
Noise and interference
Sidelobe echoes false echoes
Noise and interference
Vertical Mode
Vertical Mode Concept
Setting the vertical display
Vertical mode concept
Overview
Typical vertical display
Vertical Mode Indications and Marks
Vertical 1 display indications and markers
Solid Line Dashed Line
Vertical bearing mark, tilt mark
Vertical scan and horizontal scan ranges
Trackball mark position reference mark
Auto Train
Auto train
Measuring the Range
Measuring range with the trackball
Select V-SCAN Setting and press the Menu key
TVG setting dialog box
Vertical Mode
Suppressing Bottom Tail
Adjust 2nd AGC
Rejecting Interference and Noise
Noise limiter
Suppressing sidelobes
Dialog box
Vertical Expansion Display
Vertical 1 expansion display
Gain Control Wide Beamwidth
Others menu description
Setting window
Display size
Application to Bonito and Tuna Fishing
Searching
Tracking
Approaching
Catching
Catching
Slant Mode
Slant mode single display
Sensor
Slant mode combination display
Dialog box for setting slant combination display
H1 display Slant display
NUMERIC/ Graphic Data Display
Display Range
Tilt Angle
Automatic tilt
Auto tilt concept
Auto Training
Eliminating Weak Echoes
Scan Setting menu
Suppressing Bottom Tail
Decrease pulse length
Adjust Near AGC
Fish echo
Rejecting Sonar Interference and Noise
Changing Tx interval
Noise limiter
Adjusting Beamwidth
Tracking a Fish School target lock
Fish school tracking mode
Position tracking mode
Target Lock menu
Detecting Fish Schools Aurally
Selecting audio sector
Offcenter
Manual offcenter
Automatic offcenter
Fish Alarm
How to set the fish alarm zone
Numeric
Measuring Fish School Speed
Deleting fish marks
Event Mark, Own Ship Position Mark
Entering an own ship position mark
Erase Marks menu
Net Course Mark
21˚
Others sub menu
Others menu description
Scan Color
TVG setting window
Interpreting the Slant Display
Surface fish school
Bottom fish school
Sea surface reflections
False echo by sidelobe
This page intentionally left blank
Echo Sounder Mode
Typical Echo Sounder Displays
Echo sounder 1 display
Indications and markers on the echo sounder 1 display
Trackball mark position reference mark
Echo sounder 2 net recorder or echo sounder display
Downward-looking net recorder display
Echo sounder + net recorder display
Echo sounder combination mode ES1 + ES2
Echo sounder combination display
Upward + downward looking net recorder display ES2 mode
Echo Sounder 2 display Upward + downward looking display
Enabling an echo sounder mode
Selecting an Echo Sounder Mode
Display mode dialog box
System menu setting and available displays
Echo sounder mode configurations and menu setting
Selecting Display Range
ES1 SETTING, ES2 Setting menus
Range and display shift concept
Dialog box for setting numeric data
Range dialog box
ES1 Setting and ES2 Setting menus
Picture Advance Speed
Picture advance speed dialog box
Measuring Depth, Distance
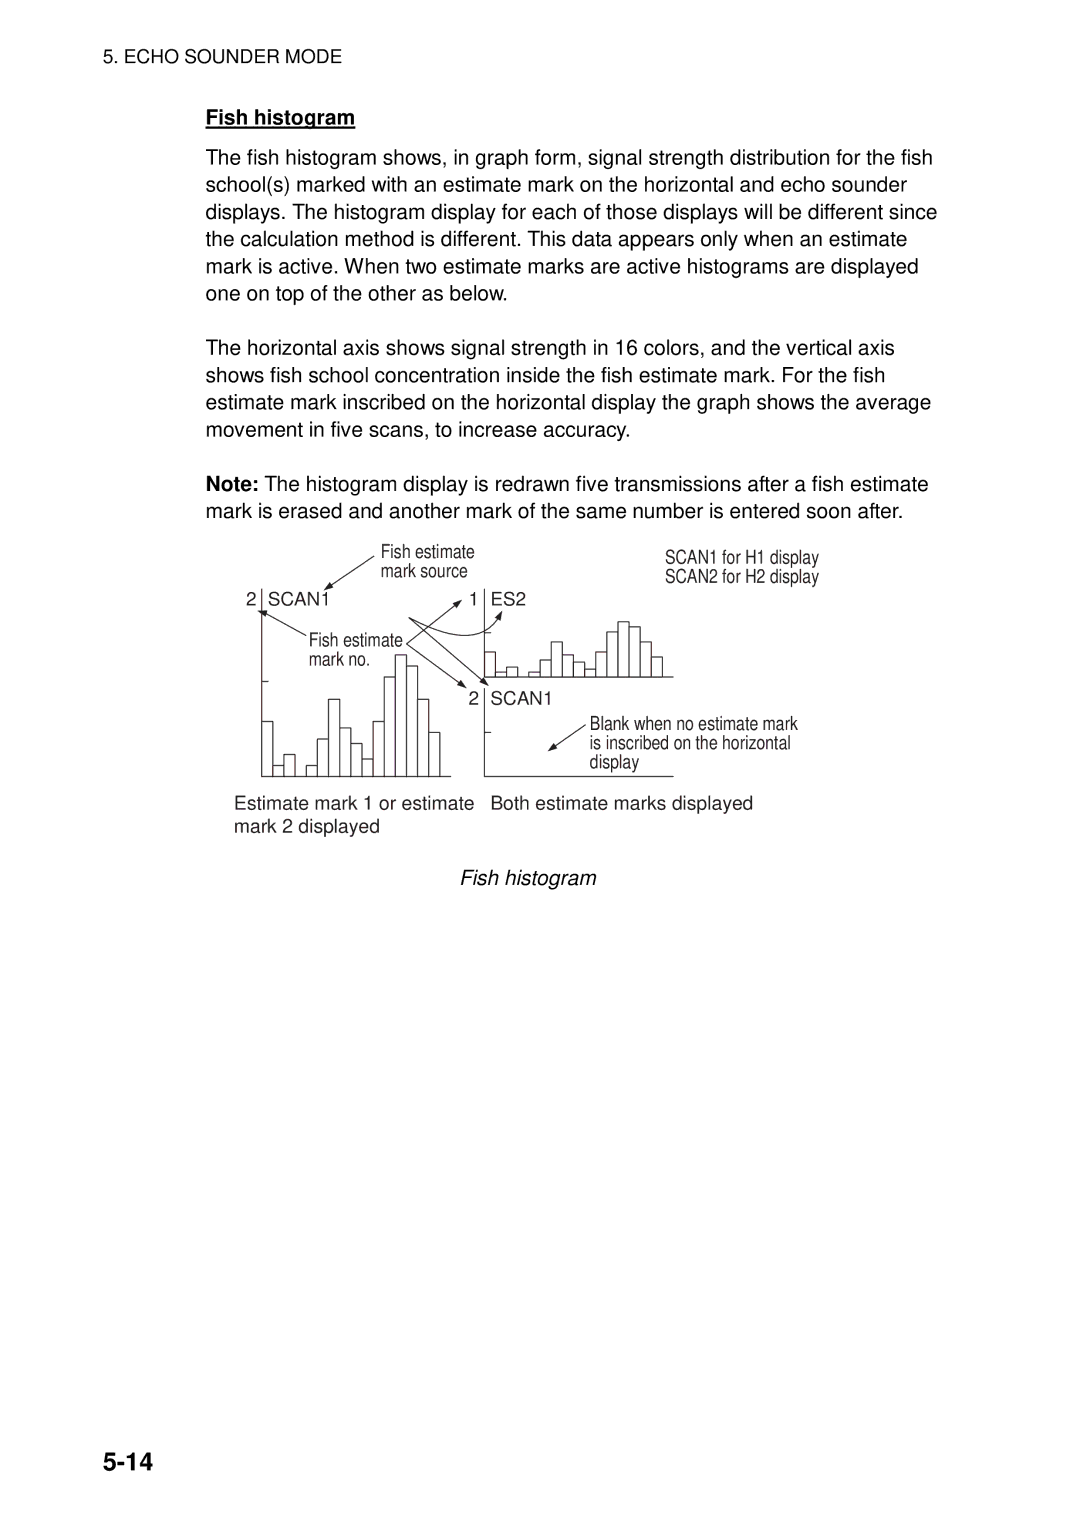
Estimating fish concentration with estimate marks
Fish histogram
Fish histogram
ES1 Setting menu
ES1 Setting Menu Overview
ES1 setting menu description
ES2 Setting menu net recorder connected
10 ES2 Setting Menu Overview
ES2 Setting menu description
History Mode
History mode concept
Sample History Display
How to interpret the history display
How to Interpret, Set the History Display
Interpreting the history display
Setting the history marker
Slant range and tilt angle
Setting the width of the history marker
Horizontal slice width dialog box
Setting the picture advance mode
Full Numeric/Graphic Data Display
NUMERIC/GRAPHIC Data Display
Full Numeric/graphic data display
Abbreviated Numeric/Graphic Data Display
Abbreviated Numeric/graphic display
Numeric/graphic data description
Numeric/Graphic Data Description
On next
Numeric/graphic data description con’t. from previous
Customizing the Equipment
User Menu
Deleting items from user menu
Main menu user menu
Programming the user menu
Message for registration of user menu item
Example default function programs
Function Keys F1-F6
Executing a function
Function dialog box for storing picture
Dialog box for selection of presentation mode
Dialog box for adjustment of panel dimmer
Function dialog box for recalling picture
Function dialog box for erasing fish marks
Dialog box for erase ship track
Programming function keys
Confirmation for registering function key
Erasing programs
Function key dialog box
Selecting a user program
User Prog Control
Programming the User Prog control
User program options
This page intentionally left blank
Others Menu
Erase Marks menu
Display Setting menu
Opening the Display Setting menu
Display Setting menu description
Display Settng menu
Tilt
Opening the Alarm & Audio menu
Alarm & Audio menu
Alarm & Audio menu description
Opening the PRESET, Memory Card menu
PRESET, Memory Card menu
PRESET, Memory Card menu description
Initial Setting menu
Opening the Initial Setting menu
Initial Setting menu description
Mark Display menu
Range rings
Heading mark
Bearing scale
Net movement plot
Data on ship’s track
Fish marks connected with line
Mark Size menu
Target lock mark
Mark Size menu
Others Menu
Data Display menu
Data Display menu
Current VEC & Wind menu
Current flow direction settings
Current VEC & Wind menu
Xmtr Distance setting window
NET Sonde Setting menu
NET Sonde Settng menu
NET Shoot Setting menu
NET Shoot Setting menu
Depth Display menu
Stabilization menu
Stabilization menu
Test menu
Initialization menu
Initialization menu
Time offset dialog box
Storing Image, Configuration
Memory Card Operations
10-1
Processor unit
10-2
Memory Card menu
10-3
Loading, Deleting Files
Memory Card menu, recall, delete dialog box opened
Formatting Memory Cards
10-4
MAINTENANCE, Troubleshooting
Preventive Maintenance
Cleaning the equipment
11-1
Hull unit maintenance
Hull Unit Maintenance
11-2
Fuse Replacement
11-3
Unit and fuse
Unit Fuse rating
Troubleshooting
Troubleshooting
Symptom Check, Remedy
11-4
Error messages
Message Meaning, Remedy Power supply
11-5
Transducer
Error Codes
Error messages con’t from previous
Error code
11-6
Status Messages
Tests
Test menu
11-7
11-8
Board test
Board test results
11-9
Interpreting the board test results
Panel test
11-10
Panel test
Trackball check Lever check
11-11
Test pattern
Test patterns
Rx test For service technician
Noise test For service technician
11-12
Rx test sequence, Rx test message
Raising the Transducer from the Hull Unit
Raising the transducer automatically
11-13
Raise/lower control box, cover removed
Raising the transducer manually
11-14
Menu Tree
AP-1
AP-2
Appendix
AP-3
Xmtr Distance
AP-4
Tilt Interlock OFF, on
Specifications of the Color Scanning Sonar
FSV-84
Transceiver Unit
Power Supply
Index
IN-1
IN-2
Indications
IN-3
OFF Center key Offcentering
Vertical mode Smoothing
IN-4
IN-5
V1/S, V2 keys