C++ SoftBench Users Guide
Manufacturing Part Number B6454-97413 June
Legal Notices
Page
Printing History
Convention Description
Boldface font
Page
Contents
Using SoftBench Configuration Manager
Using SoftBench Editors
Using SoftBench Class Graph/Editor
Using SoftBench Debugger
Contents
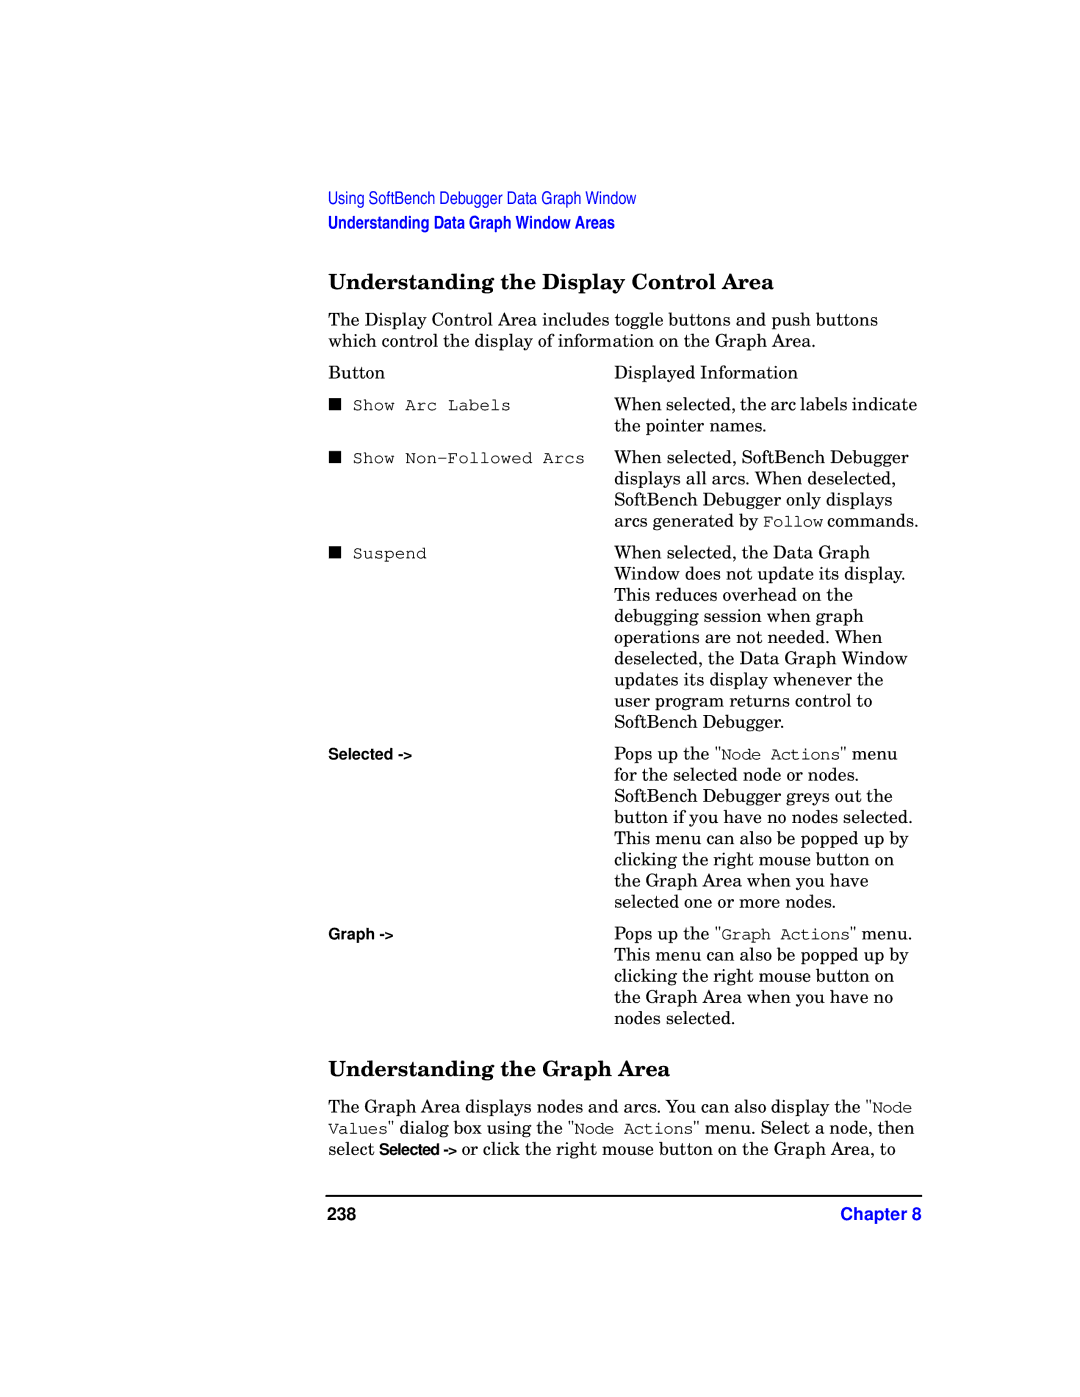
Using SoftBench Debugger Data Graph Window
Using Static Graphs
Using SoftBench File Compare
Using SoftBench Graph Windows
Using Regular Expressions
Contents
Maximizing Your Results with
SoftBench Task Flow
Major Software Development Tasks Supported by SoftBench
More sets of build instructions and dependencies
Understanding Projects
SoftBench Tools Interacting with Project and Files
Building Targets
Understanding Build Configurations and Packages
Understanding Projects
Choosing Between Project Build and External Build Models
Simplified Build Configuration, Package, and Transform Series
Understanding Projects
One Project, One Author
Sharing Projects with a Team
One Project, Many Authors
Team Members Cloning the Project Definition
One Project with Subprojects, Many Authors
Team Members Using Subprojects
Team Members Sharing the Project Definition
Sharing Projects with a Team Chapter
Planning Your Project
Configuration Management
Using the SoftBench Integrated Environment
Editors
SoftBench Static Analyzer
SoftBench File Compare
Using SoftBench Tools Throughout Your Development Cycle
SoftBench Debugger
SoftBench Message Monitor
Using SoftBench Tools Together
Using SoftBench Tools on Multiple Projects
Tools That Can Directly Invoke Other Tools
Using SoftBench Tools as Standalone Tools
10 Iconize and Normalize Project Buttons
Reusing Tool Windows
Copying Data between SoftBench Tools
An Example SoftBench Session
An Example SoftBench Session
Learning SoftBench
Using SoftBench
Prerequisites to Using SoftBench
Shell Syntax
Starting SoftBench
Understanding SoftBench Window Areas
Unexpanded SoftBench Window
Description of SoftBench Window Areas
Window Area Description
Static, and Optimized compiler
Understanding the Builder
Expanded SoftBench Window Displaying Builder
Expanded SoftBench Window Displaying SoftBench
Understanding the SoftBench CodeAdvisor
CodeAdvisor
Understanding SoftBench Window Areas
Setting Up a Project
Creating a Project Using Project Build
Create Project Dialog Box
Creating a Project Using External Build
Create Project Dialog Box for External Build
Cloning a Project from an Existing Project
Repartitioning an Existing Project
Creating a Subproject
Modifying a Project Definition
Creating Files within a Project
Adding Existing Files to a Project
Add Files to Project Dialog Box
Adding Existing Files to a Project
Defining Targets for Project Build
Creating a Target
Specifying Dependency Relationships
Customizing Build Configurations
Manage Build Configuration Dialog Box
Using Build Packages
External Build Command Dialog Box
Defining Targets for External Build
Defining Targets for External Build
Using the Target Graph
Build Model Operations in the Target Graph
Understanding the Graph
Operation Project Build External Build
Graph Node States
Displaying Dependencies
Color Meaning
Building a Selected Target
Controlling Graph Complexity
Starting Your Configured Editor
Setting the Compile Mode
Building Projects and Targets
Compile Mode Settings Default Compiler Flag
Using the External Build Command Dialog Box
Previewing the Build
Compiling Instead of Building
Handling Errors
Building Subprojects
Interpreting Error Messages
Browsing and Correcting Build Errors
Running the Build on a Remote System
Checking Your Code Using SoftBench CodeAdvisor
Running Other SoftBench Tools
Managing Your SoftBench Environment
Adding and Removing Tool Icons
Choosing Tool Preferences
Registering New Tools with SoftBench
Customizing SoftBench by Setting Resources
Accessing Distributed Data and Tools
Integrating with CDE
Running SoftBench on a Remote System
Stopping SoftBench
Restoring Your Previous SoftBench Session
Getting Help
11 SoftBench Online Help Window
Using the Help Menu
Accessing On Item Help
If Something Goes Wrong
Condition or Explanation Message
For More Information
For More Information Chapter
Using SoftBench Configuration
Understanding SoftBench CM
Integration of SoftBench CM with SoftBench
Understanding SoftBench CM
Getting Started a Brief Overview
Choose Directory Create…
Choose Actions Check Out to Local Directory
Managing the Archive System
Browsing Local Network Servers and Archives
Viewing Local Servers and SoftBench CM Archives
File or directory name
Creating an Archive Directory
SoftBench CM Main Window
Local Directory
Creating a Mapping between an Archive Directory
SoftBench CM File Mapping
Modifying Mappings between Local and Archive Directories
Show / Modify Mappings Dialog Box
100
Chapter 101
Checking Out Archive Files
Managing Archive Files and Directories
Creating Initial Archive Files
102
Cancelling Archive File Check Out
Updating a Local Directory
Viewing Contents of Archive Files
Viewing an Archive File
Locking an Archive File
Deleting Archive Files and Directories
106
Viewing the Revision History of Archive Files
Breaking a Lock on an Archive File
Break File Lock Dialog Box
Show Revision History Dialog Box for an Archive File
108
Setting Archive Display Filters
Checking In Modified Files
Managing Local Files
Modifying Local Source Files
110
Chapter 111
Understanding Symbolic Names
Creating a Default Symbolic Name for Archive Files
112
Defining Symbolic Names
Symbolic Name Example
Action Result
Symbolic Names and Revision Numbers File File Y
Actions and Results After Setting Symbolic Name List
114
SoftBench CM Command Line Man Pages
Using the SoftBench CM Command Line Interface
Man Task Description
116
Using SoftBench Editors
Using Editors with Projects
118
Configuring SoftBench vi Editor
Configuring an Editor
Configuring SoftBench Program Editor
120
Starting the Configured SoftBench Editor
Editing with SoftBench XEmacs Editor
122
Using SoftBench XEmacs
SoftBench XEmacs Main Window
Accessing Help
Editing Multiple Files
124
Chapter 125
SoftBench vi Editor Window
Editing with SoftBench vi Editor
126
Using the Mouse Pointer Versus the Text Cursor
If the vi autowrite SoftBench vi Editors behavior Option
Reusing the Edit Window
128
Selecting, Copying, and Pasting Text
Compiling a Program File
Accessing SoftBench Static Analyzer from the Editor
Calling Other SoftBench Tools from the Editors
Building a Project
Setting Breakpoints in a Program File
Using Configuration Management
132
Using SoftBench Class
Understanding the SoftBench Class Graph/Editor Use Model
Editing C++ Structures with SoftBench Class Graph/Editor
134
SoftBench Class Graph/Editor Use Model
Synchronizing Editor Views and the Static Database
136
Chapter 137
Viewing the Existing Class Hierarchy
Using SoftBench Class Graph/Editor in Your Work
138
Creating New Components
Modifying Existing Components
Deleting Existing Components
140
Modifying an Existing Program
Sample Use Models
Creating a New Program
Working with Class Templates
142
Condition Explanation
144
Using SoftBench CodeAdvisor
Using SoftBench CodeAdvisor
146
Chapter 147
148
Preparing Your Program with Project Build
Performing the Check Code Operation
Preparing Your Program with External Build
Checking Your Program
Accessing SoftBench CodeAdvisor
Selecting Rule Groups
150
Viewing Violations
Violations Display
Filtering Rule Violations
Terminating SoftBench CodeAdvisor
152
Chapter 153
154
Using SoftBench Debugger
Understanding SoftBench Debugger
156
Chapter 157
158
Preparing Your Program for Debugging
SoftBench Debugger Window
Using SoftBench Debugger Window Areas
160
Chapter 161
162
Tearing Apart the Main Toolface
Tear Apart Main Toolface
164
Loading or Rerunning an Executable Program
Specifying the Runtime Environment
Load Executable Dialog Box
166
Specifying the Working Directory and Program Arguments
Setting Environment Variables
Specifying Standard I/O
Specifying Source Locations
168
Debugging Executables in a Project
Adding Source Directories for External Builds
Add Source Directories Dialog Box
170
Stepping through Your Program
Interrupting in System or Non-debuggable Routines
Interrupting a Running Program
172
Chapter 173
Interacting with a Standard I/O Program
Interacting with Your Program
174
Interacting with a Terminal-Smart Program
Interacting with a Window-Smart Program
176
Specifying Identifier Locations
Specifying Program Location
Specifying Variables
178
Chapter 179
180
Examining and Changing Data in Your Program
Examining Data in Your Program
182
Printing Hex or String Values
Using Debugger Variables
Changing Data in Your Program
Using Expressions
184
Using Constants
Viewing the Call Stack
Calling Functions
186
Viewing Thread Stacks
Stack View Window
Understanding the Operation of Your Program
188
Setting and Using Breakpoints
Debugging a Program Using Breakpoints
Using the Editable Source Area
Setting a Breakpoint
190
Break Menu
Using the Breakpoint Set/Change Dialog Box
Using the Break Menu
192
Viewing and Modifying Breakpoints
Breakpoint Set/Change Dialog Box
Changing Verbose / Silent Status
Clearing a Breakpoint
Changing Active / Suspend Status
194
Executing DDE Commands at a Breakpoint
196
Setting Group Breakpoints
Setting C++ Breakpoints
Viewing and Modifying Group Breakpoints
198
Setting and Using Watchpoints
Creating Watchpoints
Using the Watch Menu
Using the Data Watchpoint Set/Change Dialog Box
200
Viewing and Modifying Watchpoints
Data Watchpoint Window
Clearing a Watchpoint
202
Chapter 203
Creating Traces
Using the Trace Menu
Tracing Program Flow
204
Viewing Traces
Using the Trace Set/Change Dialog Box
Trace Set/Change Dialog Box
Clearing Traces
206
Correcting Errors in Your Program
Editing Source Code
Synchronizing Files
208
Debugging Dynamic Libraries
10 Dynamic Images/Libraries Dialog Box
210
Viewing Assembly Language and CPU Registers
Tracing Assembly Language
Tracing Registers
212
Chapter 213
Viewing and Editing Intercepts
Handling Signals and Events
214
Chapter 215
Handling Signals
216
Debugging After a Program Fails Core Dump
Signal Error Message Text Name
Debugging with a Core File
218
Debugging Forked Processes
Viewing and Manipulating Threads
Debugging Threaded Applications
220
Setting Breakpoints on Threads
Attaching the Debugger to a Running Program
222
Debugging C++ Programs
224
Accessing Inherited C++ Values
Using Breakpoints for Exception Handling
Debugging Static Constructors
226
Debugging Optimized Code
Customizing User Buttons
Customizing SoftBench Debugger
Specifying Debugger Options
228
Chapter 229
230
Chapter 231
Offset argument.
232
Chapter 233
234
Using SoftBench Debugger Data
Stopping a Browsing Session
Starting and Stopping the Data Graph Window
Beginning a Browsing Session
236
Understanding the Layout Control Area
Understanding Data Graph Window Areas
Data Graph Window Areas
Understanding the Graph Area
Understanding the Display Control Area
238
Object Selected Actions Allowed
Data Graph Window Action Menus
Reading Nodes
Reading Arcs
Using Dialog Boxes
Understanding the Window Control Area
240
Using the Node Values Dialog Box
Using the Graph Area
Displaying New Nodes
Node Values Dialog Box
242
Displaying Data Members
Setting Data Member Values
Node Values Dialog Box Action Menu
Following Selected Pointers
Stopping a Graph Process
Suspending Graph Updates
Deactivating the Graph
244
Verifying Correct Data Structures
Viewing btree
Binary Tree Node with Children
Binary Tree Node
Continuing Program Execution
246
Showing Nodes
Viewing Values of Data Members
Dereferencing Particular Data Members
Viewing Values from Embedded Arrays
Viewing Values from Multiple Nodes
Viewing Embedded Arrays
Showing Values On the Graph
Viewing Data Members on The Graph Nodes
250
Using SoftBench Static
Starting SoftBench Static Analyzer
252
Chapter 253
Generating Static Data
Preparing to Make Queries
254
Specifying Static Data to Analyze
Using the Default Analysis File Set
Updating Static Data without Building
Including Subprojects and Parent Projects
Keeping Analysis Files Current
Customizing the File Set in Non-Project Mode
256
Filtering Queries by File Set
Determining the File Set Status
Using SoftBench Static Analyzer Window Areas
258
SoftBench Static Analyzer Window and Areas
Making Queries Based on a Program Identifier
Making Textual Static Queries
Making General Queries
260
Selecting Text
Understanding the Types of References
Determining Identifier Classification
Relationships among Reference Queries
262
Troubleshooting Invalid Identifiers for Queries
Using Pattern Matching
Editing the Source File
Using Query Results
Browsing the Query Result
Updating the Database
Performing a Query
Simplifying Query Results
Filtering Results Using the File Set
Command Description
SoftBench Static Analyzer Display Options
Unfiltered Source File List
Filtered Source File List
Filtering C++ Query Results
Using Scoping
268
Scoping Prerequisites and Constraints
Troubleshooting Scoping Information
Scoping Example
270
Deleting a Query Result
Redisplaying Past Queries
Redisplaying Query Results
Saving and Printing a Query Result
272
Generating Static Data from the Command Line
Using SoftBench Static Analyzer in Standalone Mode
Searching Subdirectories
Using the Staticfileset File
274
Customizing SoftBench Static Analyzer
Analysis file set choose F ile
Condition or Message Explanation
276
Chapter 277
278
Chapter 279
Staticrmfile1
280
Chapter 281
282
Using Static Graphs
284
Starting SoftBench Static Analyzer Graphs
Making Graphical Static Queries
General Static Graph Features
286
Finding Graph Nodes
Operating on Static Graph Nodes
Displaying Nodes on Another Graph
Switching between Static Graphs
288
Using Description Boxes
Function Description Dialog Box
Saving Static Graph Images to Files
Setting Breakpoints for SoftBench Debugger
290
Chapter 291
Reducing Graph Complexity
Simplifying Graph Displays
292
Filtering Sourceless Nodes
Removing the Graph Legend Viewing Multiple Graphs
Customizing Static Graphs
294
Using SoftBench File Compare
Understanding the Working Directory Input Box
Understanding the SoftBench File Compare Window
Understanding the Menu Bar
296
Understanding the Text Areas
Using the Left File and Right File Input Boxes
Using the Merge File Input Box
Reading the Gutter Column
Left Right Selection Column
Selecting Lines for Merging
298
Highlighting Differences
Traversing by Single Line
Comparing Two Files
300
Merging Compared Files
302
Chapter 303
304
Using SoftBench Message Monitor
Starting SoftBench Message Monitor
306
Understanding the SoftBench Message Monitor Window Area
Understanding Broadcast Messages
Clearing the Broadcast Message Area
308
Composing and Sending a Message
Send Message Dialog Box
For SoftBench XEmacs
310
Specifying a Log File
Logging Messages
Starting and Stopping Message Logging
312
Using SoftBench with SQL
Determining Supported Environments
314
Configuring SoftBench with SQL
Using Default SQL File Types
Using SQL with Project Build
SQL File Extensions for C Language
316
Using SQL with External Build
Updating Rdbms Versions
318
Using SQL Preprocessor Wrappers
Using SQL with SoftBench Tools
Debugging with SQL
Debugging Expanded SQL Statements
320
Editing and Rebuilding with SQL for SoftBench Debugger
322
Using SoftBench Graph Windows
Accessing SoftBench Graph Windows
324
Appendix a 325
Using Save Options for the Graph Image
Using Graph Window Areas
Using Popup Menus
326
Table A-2 Graph Image File Formats Option Used for
Figure A-1 Save Image Dialog Box
Saving HP-GL and PostScript Images
Using Graph File Image Save Options
328
Saving xwd Images
Using Vertical and Horizontal Scrolling
330
Zooming In or Zooming Out
Clearing the Graph Area
Selecting Nodes and Arcs
Understanding Nodes and Arcs
Reading Graph Area Nodes
332
Appendix a 333
Moving Nodes
Table A-4 Methods for Selecting Multiple Objects Procedure
334
Appendix a 335
Controlling Graph Layout
Menu settings
Customizing SoftBench Graphs
Controlling Graph Display
Understanding Window Status Information
338
Customizing SoftBench CM Configuration
Table B-1 Server Configuration Files File Name Description
Modifying the Configuration Files
340
Configuring Where Archive Files are Stored
Figure B-1 File Mapping Between Local and Archive Files
Defining User Access to the Server
342
Appendix B 343
344
Format 1. Place user field first and permissions field second
Recommended Format for Permissions File
Format 2. Place path field first and permissions field second
Setting Logging and Debug Options
346
Appendix B 347
Migrating Archive Files From Sccs
Performing SoftBench CM Administrator Tasks
Migrating Archive Files From RCS
348
Modifying the Lockinfo File
Creating Archive Backups
Moving Archive Storage Locations
350
Using the Archive Status and Error Log
Troubleshooting
Using the Archive Activity Log
352
Using Regular Expressions
Pattern Matching
354
Appendix C 355
356
Appendix C 357
358
Appendix C 359
360
Customizing SoftBench for Native Language Support NLS
Preparing to Use NLS in SoftBench
362
Appendix D 363
Table D-1 To have Lang apply to Set Lang
Setting the Lang Environment Variable
364
Converting from One Encoding Method to Another
Rebinding Alt
366
SoftBench Mnemonics and Non-USASCII Character Inputs
Changing or Removing Menu Mnemonics
368
Customizing Keyboard Accelerators
370
Starting Your Localized SoftBench
Remote Execution Hosts and NLS
372
Editing in SoftBench
Character Input Example
374
Glossary
375
376
377
378
379
380
381
382
383
See also Project Root
384
385
386
387
388
Index
Symbols
389
390
CDE
391
392
393
394
395
396
397
398
399
400
401
402
Graph, 47, 66
403
404
405