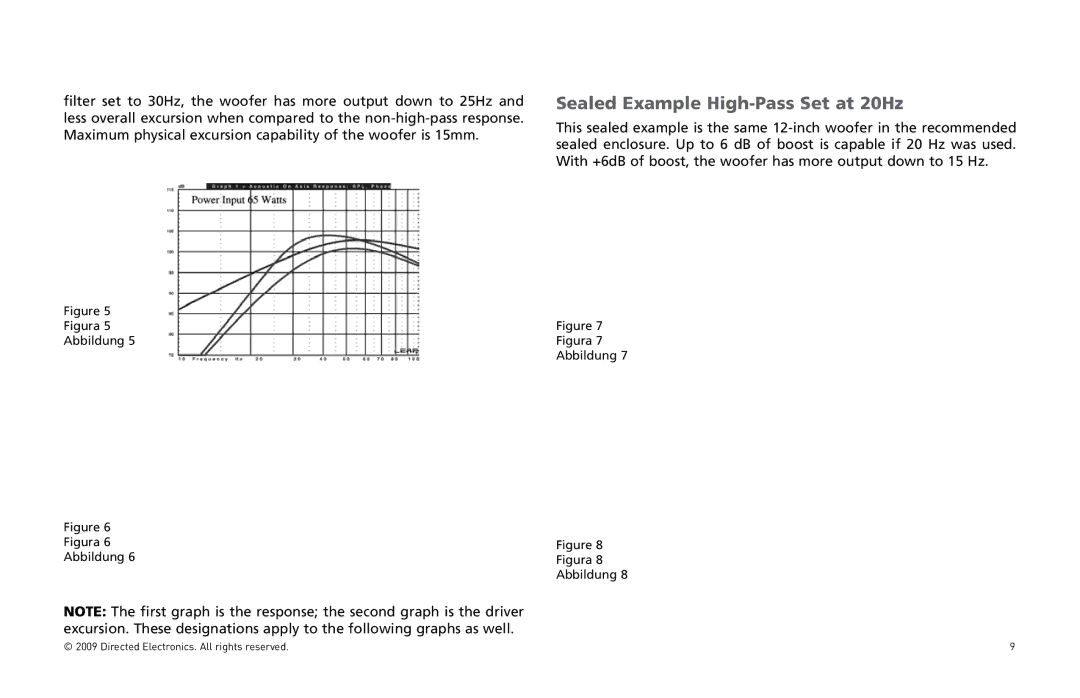
filter set to 30Hz, the woofer has more output down to 25Hz and less overall excursion when compared to the
Sealed Example High-Pass Set at 20Hz
This sealed example is the same
Figure 5
Figura 5
Abbildung 5
Figure 6
Figura 6
Abbildung 6
NOTE: The first graph is the response; the second graph is the driver excursion. These designations apply to the following graphs as well.
Figure 7
Figura 7
Abbildung 7
Figure 8
Figura 8
Abbildung 8
© 2009 Directed Electronics. All rights reserved. | 9 |
