Chapter 2: Getting Started | ||||||||
|
|
|
|
|
|
|
|
|
|
|
|
|
|
|
|
|
|
|
|
|
|
|
|
|
|
|
|
|
|
|
|
|
|
|
|
|
|
|
|
|
|
|
|
|
|
|
|
|
|
|
|
|
|
|
|
|
|
|
|
|
|
|
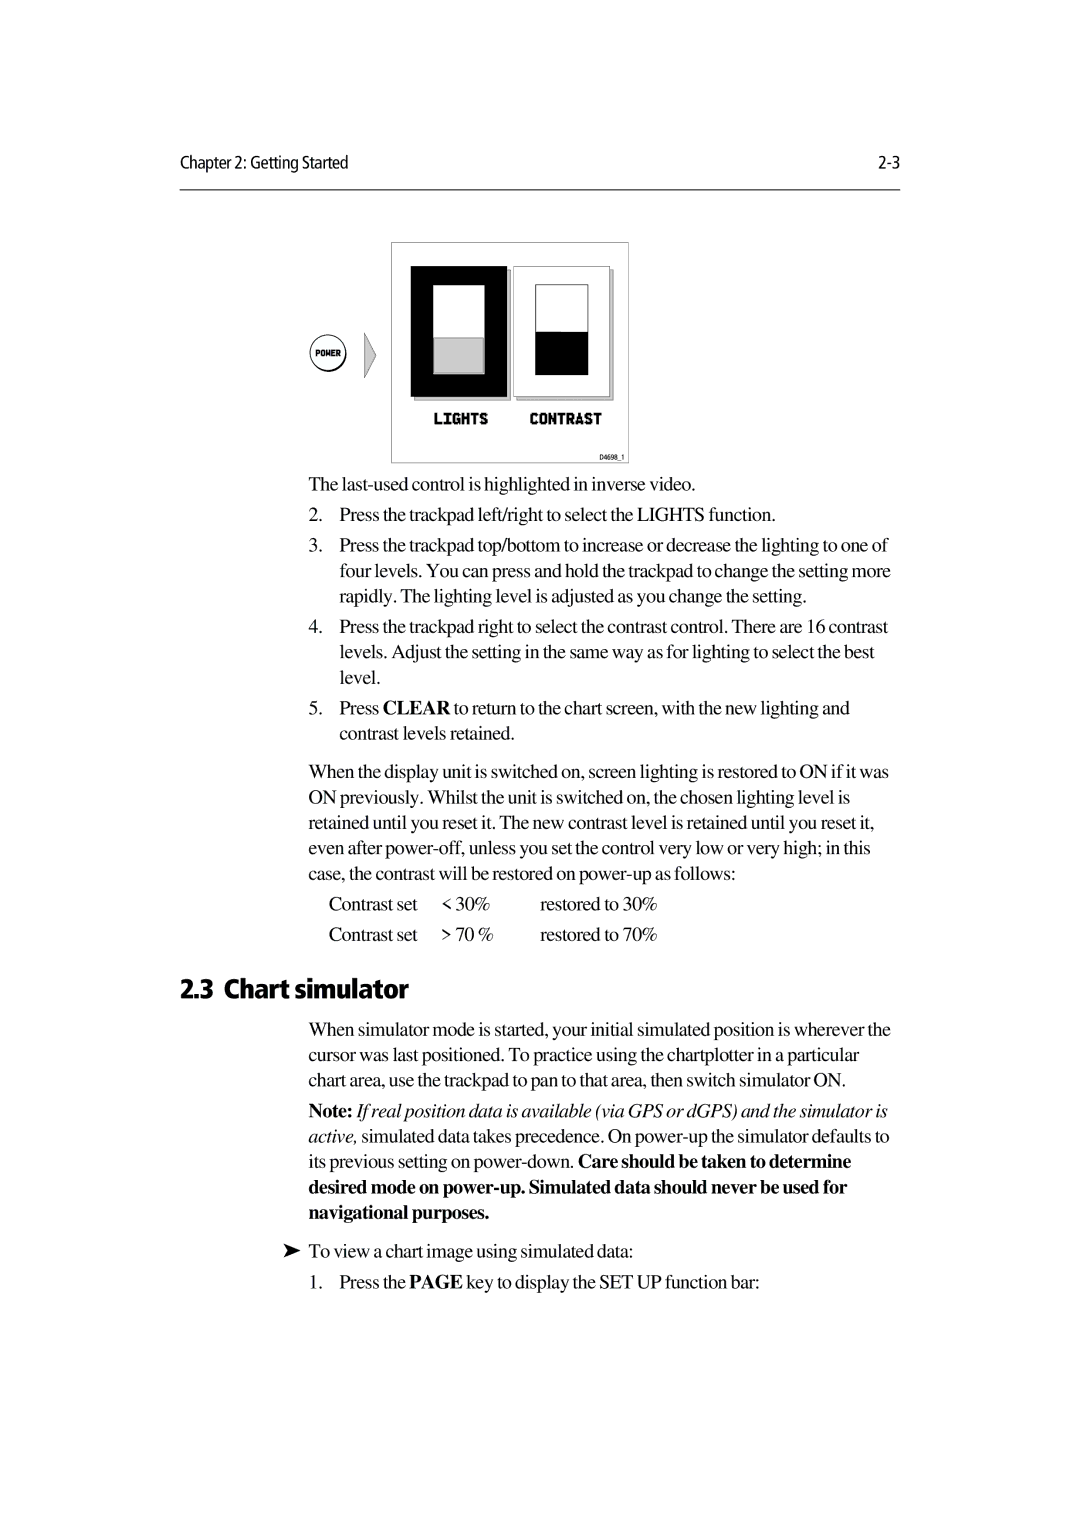
The
2.Press the trackpad left/right to select the LIGHTS function.
3.Press the trackpad top/bottom to increase or decrease the lighting to one of four levels. You can press and hold the trackpad to change the setting more rapidly. The lighting level is adjusted as you change the setting.
4.Press the trackpad right to select the contrast control. There are 16 contrast levels. Adjust the setting in the same way as for lighting to select the best level.
5.Press CLEAR to return to the chart screen, with the new lighting and contrast levels retained.
When the display unit is switched on, screen lighting is restored to ON if it was ON previously. Whilst the unit is switched on, the chosen lighting level is retained until you reset it. The new contrast level is retained until you reset it, even after
Contrast set | < 30% | restored to 30% |
Contrast set | > 70 % | restored to 70% |
2.3 Chart simulator
When simulator mode is started, your initial simulated position is wherever the cursor was last positioned. To practice using the chartplotter in a particular chart area, use the trackpad to pan to that area, then switch simulator ON.
Note: If real position data is available (via GPS or dGPS) and the simulator is active, simulated data takes precedence. On
desired mode on
To view a chart image using simulated data:
‰1. Press the PAGE key to display the SET UP function bar: