0 128
:10 64
0 32
16
8 8
0 4
2
$
0 (nitused)
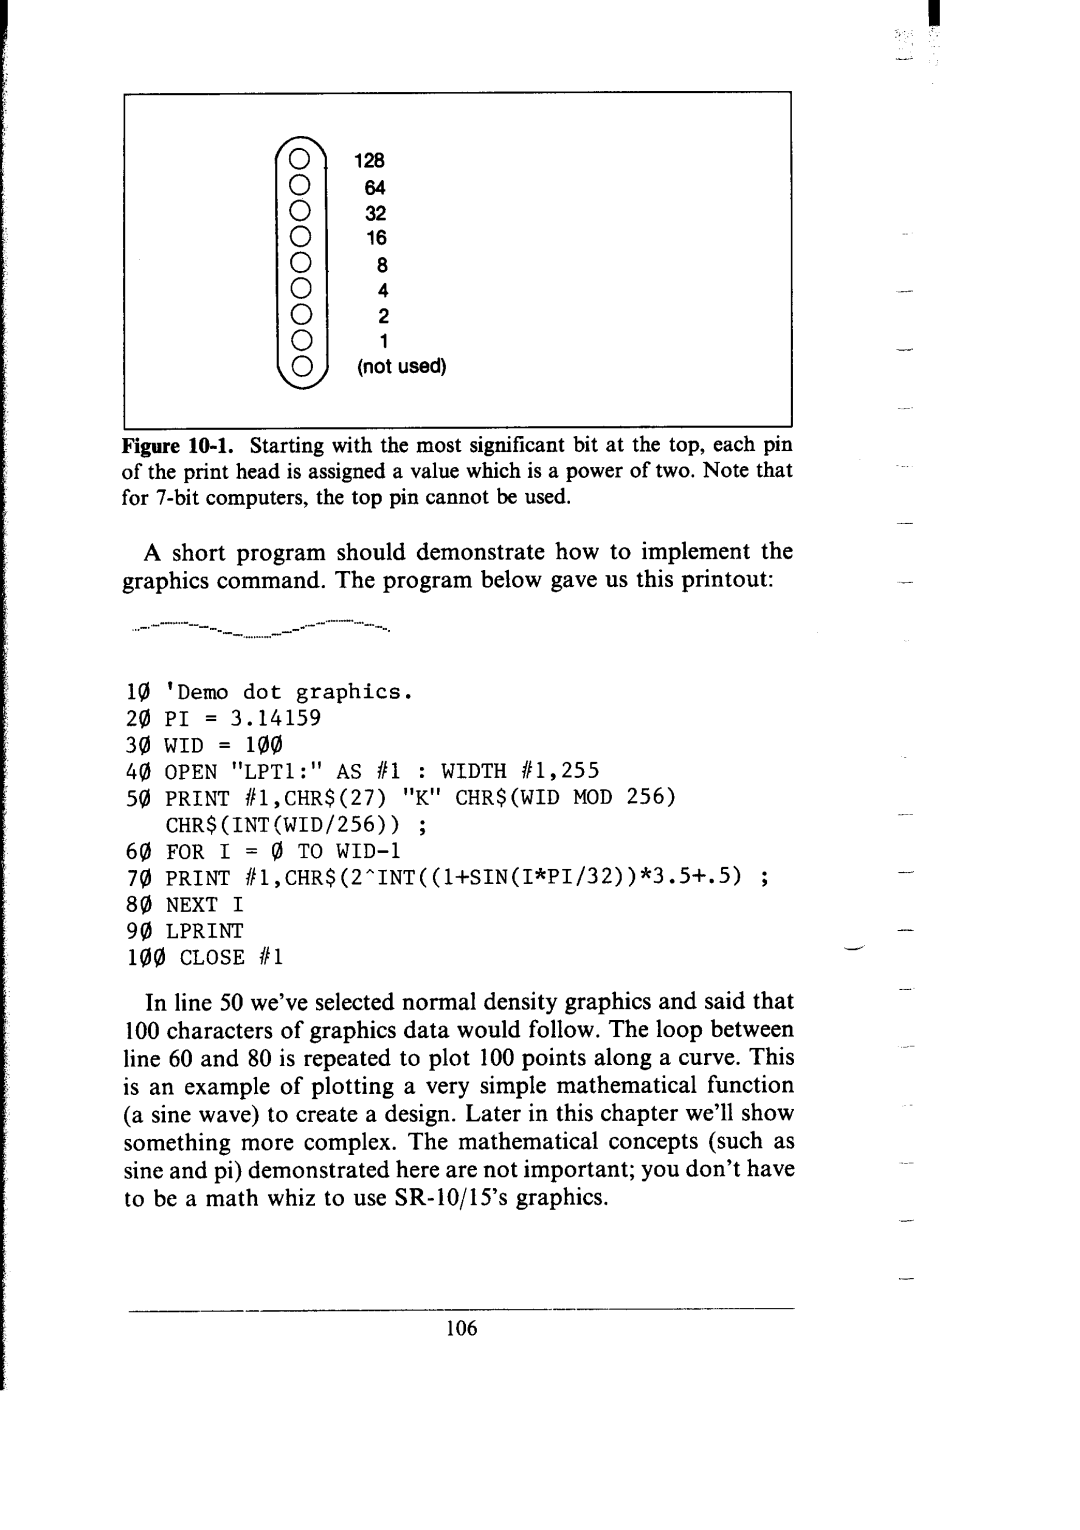
Figure 10-l. Startingwiththemostsignificantbitatthetop,eachpm oftheprintheadisassignedvaluewhichisa poweroftwo.Notethat for7-bitcomputers,thetoppincannotbeused.
A short program should demonstrate how to implement the |
| |||
graphics | command. The program below gave us this printout: | - | ||
_ |
| |||
|
|
| ||
10 ‘Demo dot graphics.
20PI = 3.14159
30WID = 100
49)OPEN “LPTl:” AS 111: WIDTH #1,255
50PRINT #l,CHR$(27) “K” CHR$(WID MOD 256) CHR$(INT(WID/256)) ;
60FOR I = 0 TO
70 PRINT #1,CHR$(2”INT((l+SIN(I*PI/32))*3.5+.5) ; -
80NEXT I
90 LPRINT | - |
100 CLOSE #1 | .- |
| |
| - |
In line 50 we’ve selected normal density graphics and said that 100 characters of graphics data would follow. The loop between line 60 and 80 is repeated to plot 100 points along a curve. This is an example of plotting a very simple mathematical function (a sine wave) to create a design. Later in this chapter we’ll show something more complex. The mathematical concepts (such as sine and pi) demonstrated here are not important; you don’t have to be a math whiz to use
-
106