Delimitation, Scroll Bar and Linking
♦Partial Analysis:
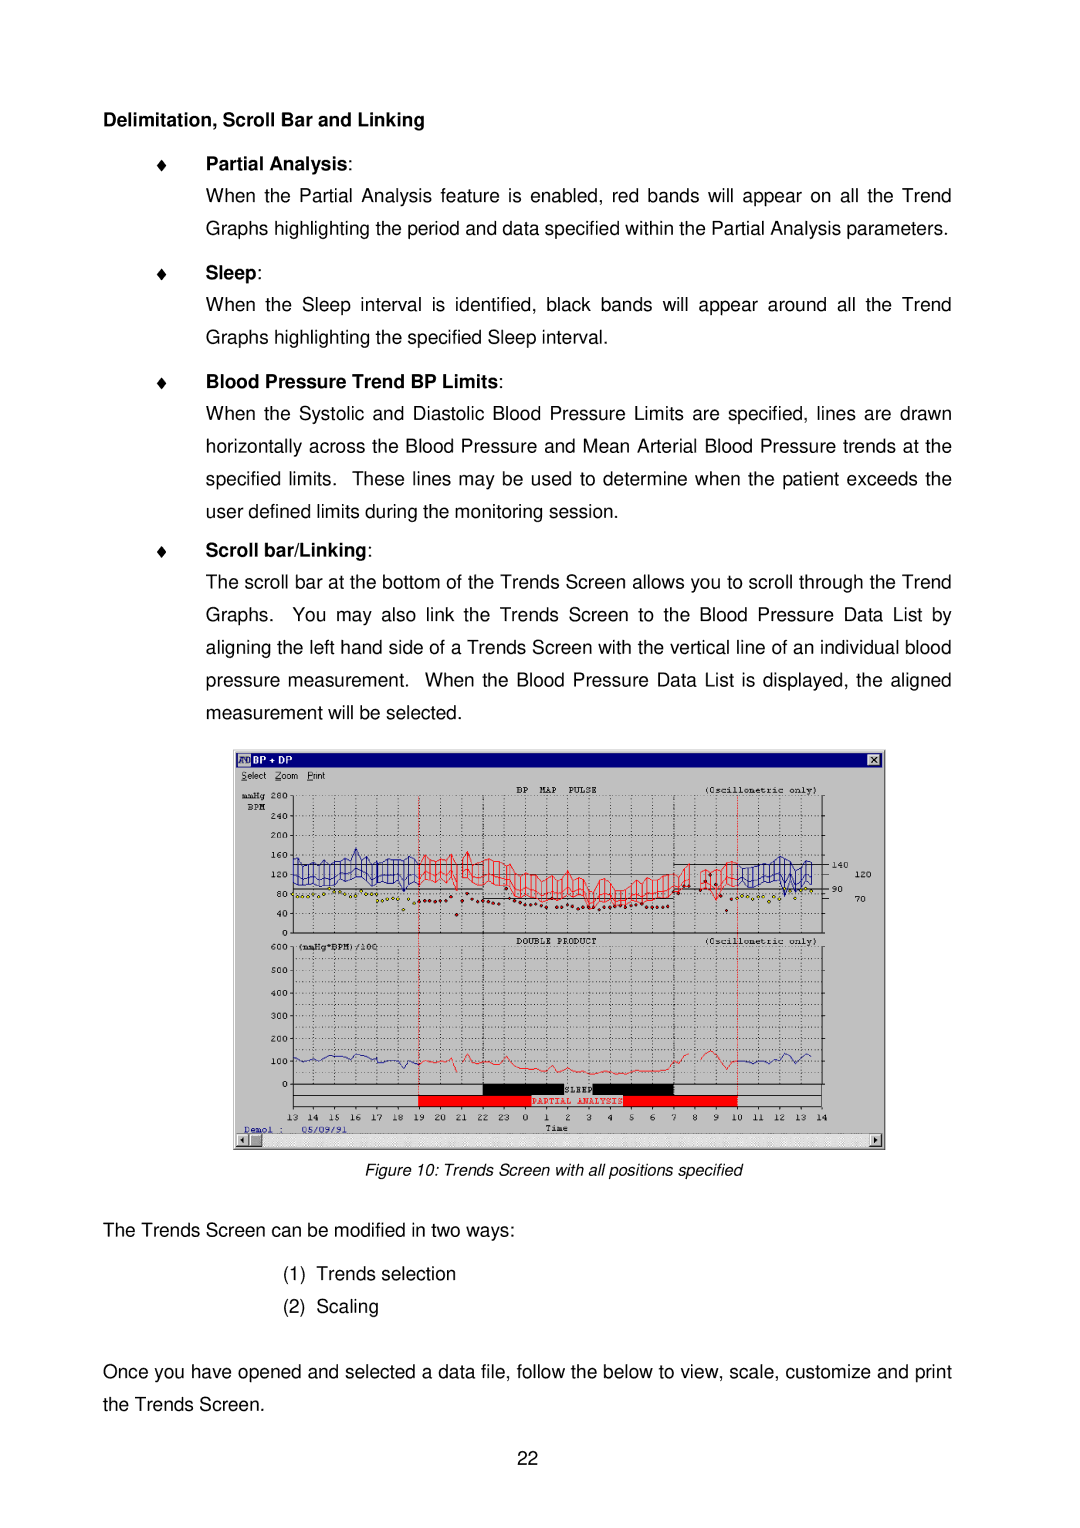
When the Partial Analysis feature is enabled, red bands will appear on all the Trend Graphs highlighting the period and data specified within the Partial Analysis parameters.
♦Sleep:
When the Sleep interval is identified, black bands will appear around all the Trend Graphs highlighting the specified Sleep interval.
♦Blood Pressure Trend BP Limits:
When the Systolic and Diastolic Blood Pressure Limits are specified, lines are drawn horizontally across the Blood Pressure and Mean Arterial Blood Pressure trends at the specified limits. These lines may be used to determine when the patient exceeds the user defined limits during the monitoring session.
♦Scroll bar/Linking:
The scroll bar at the bottom of the Trends Screen allows you to scroll through the Trend Graphs. You may also link the Trends Screen to the Blood Pressure Data List by aligning the left hand side of a Trends Screen with the vertical line of an individual blood pressure measurement. When the Blood Pressure Data List is displayed, the aligned measurement will be selected.
Figure 10: Trends Screen with all positions specified
The Trends Screen can be modified in two ways:
(1)Trends selection
(2)Scaling
Once you have opened and selected a data file, follow the below to view, scale, customize and print the Trends Screen.
22