2-6-6 Circadian Rhythm
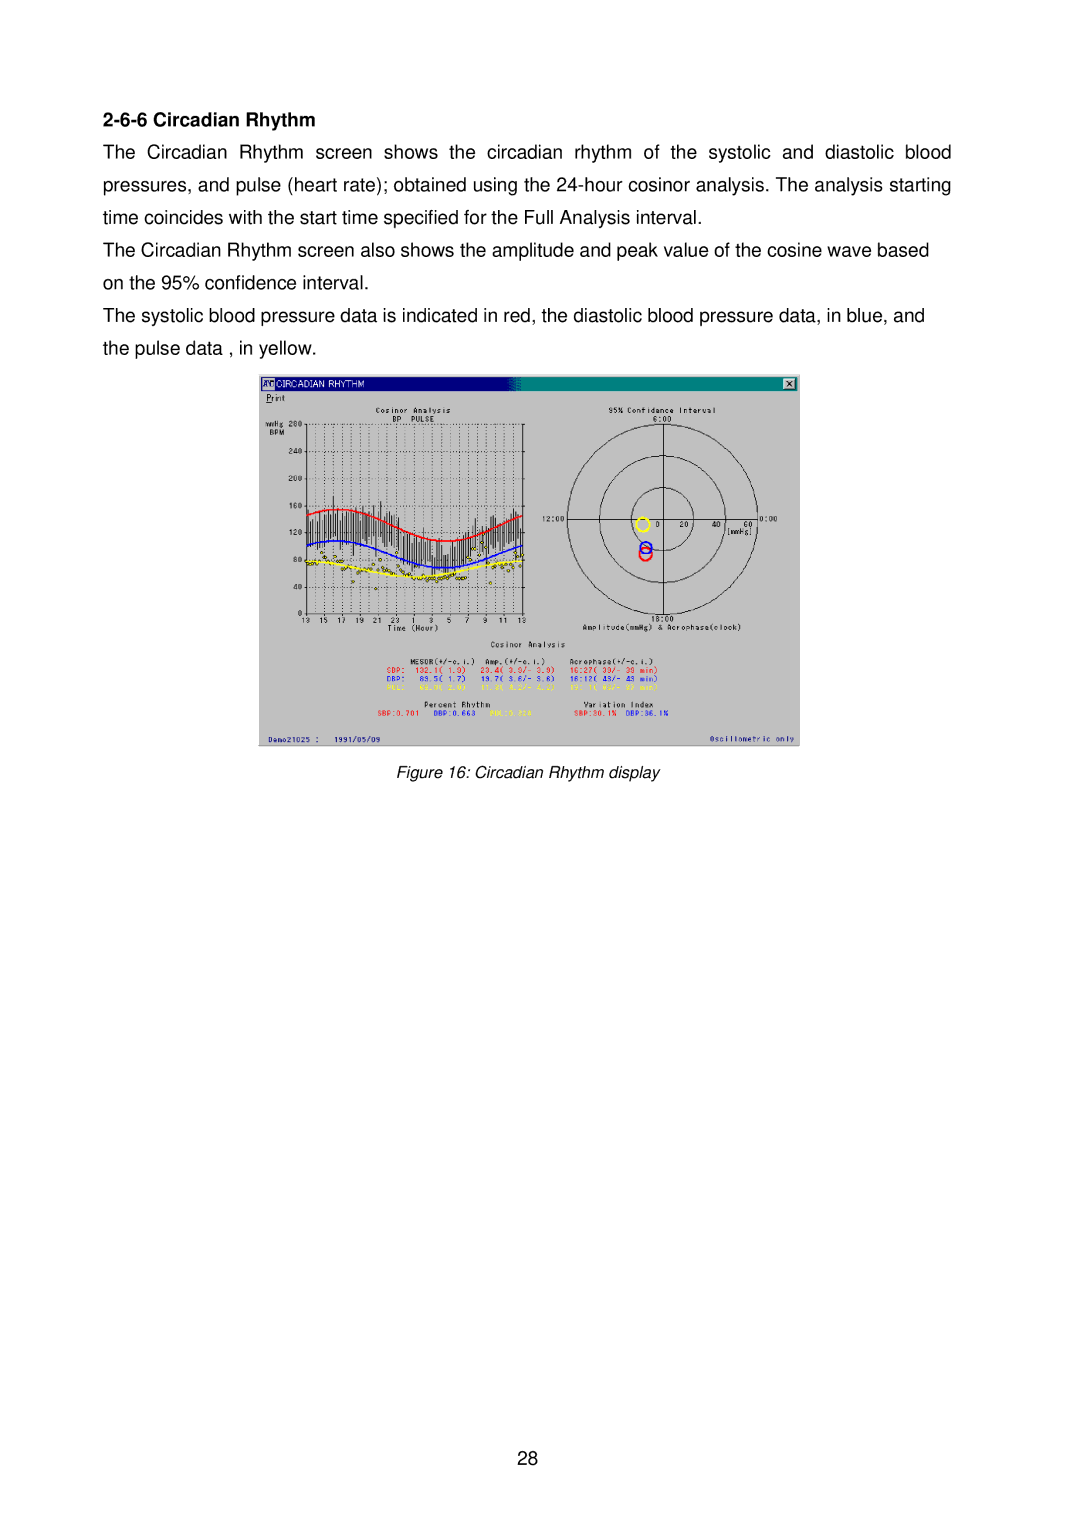
The Circadian Rhythm screen shows the circadian rhythm of the systolic and diastolic blood pressures, and pulse (heart rate); obtained using the
The Circadian Rhythm screen also shows the amplitude and peak value of the cosine wave based on the 95% confidence interval.
The systolic blood pressure data is indicated in red, the diastolic blood pressure data, in blue, and the pulse data , in yellow.
Figure 16: Circadian Rhythm display
28