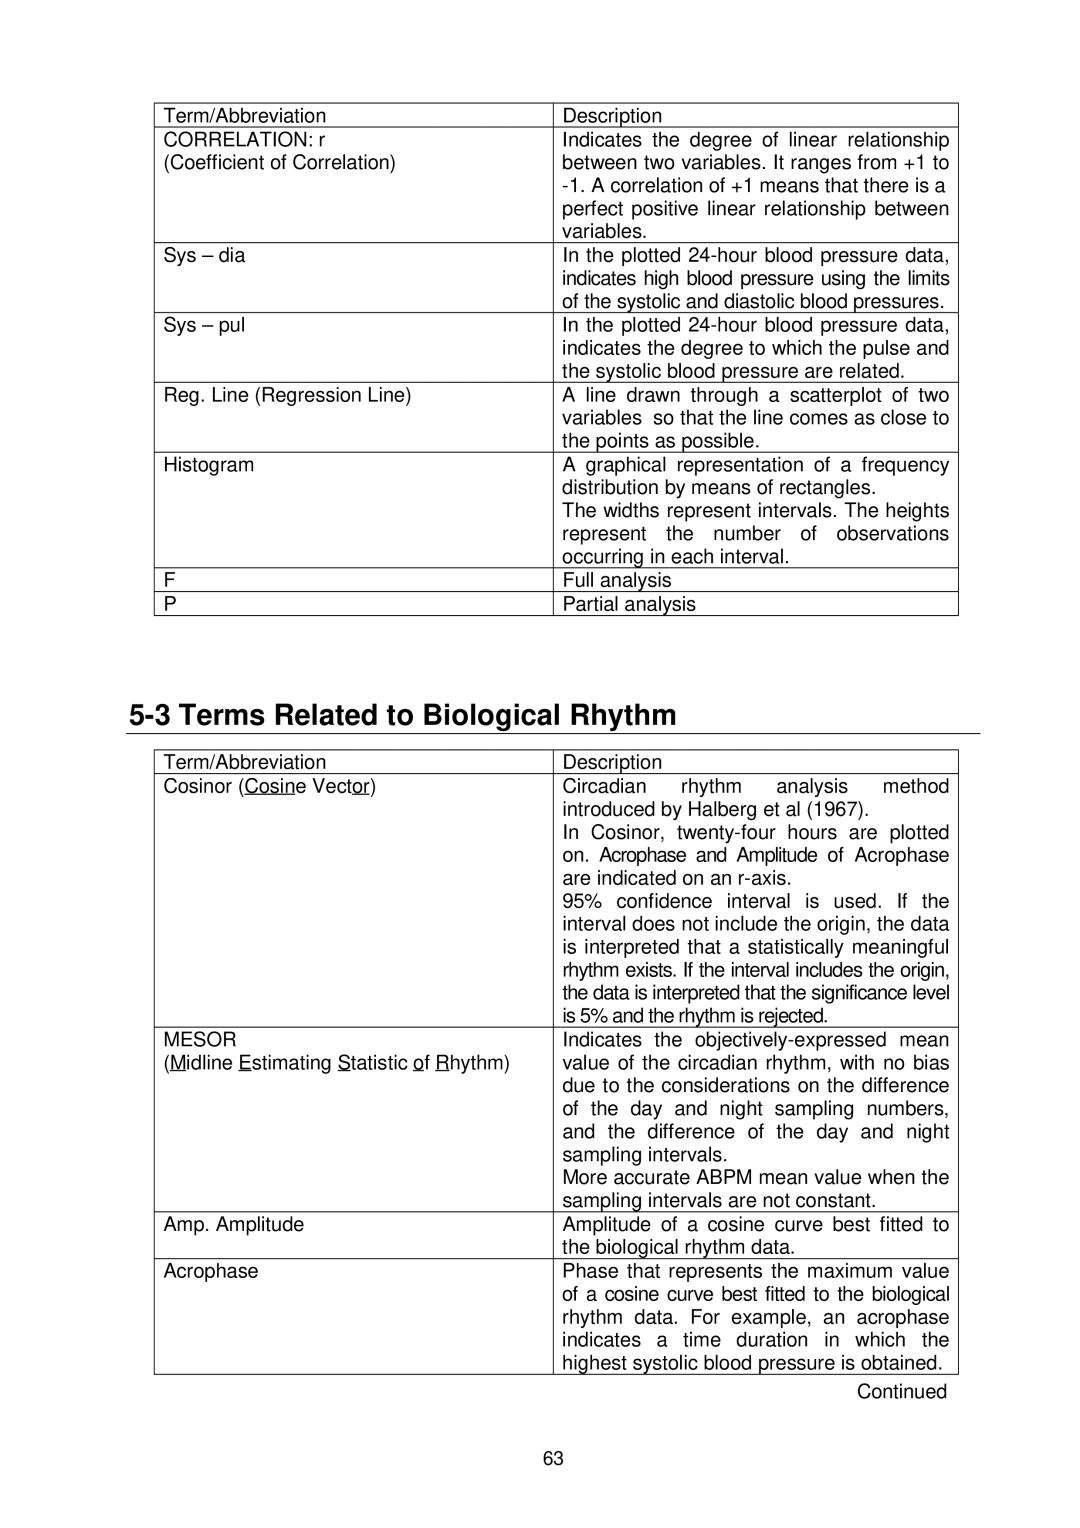
Term/Abbreviation | Description |
CORRELATION: r | Indicates the degree of linear relationship |
(Coefficient of Correlation) | between two variables. It ranges from +1 to |
| |
| perfect positive linear relationship between |
| variables. |
Sys – dia | In the plotted |
| indicates high blood pressure using the limits |
| of the systolic and diastolic blood pressures. |
Sys – pul | In the plotted |
| indicates the degree to which the pulse and |
| the systolic blood pressure are related. |
Reg. Line (Regression Line) | A line drawn through a scatterplot of two |
| variables so that the line comes as close to |
| the points as possible. |
Histogram | A graphical representation of a frequency |
| distribution by means of rectangles. |
| The widths represent intervals. The heights |
| represent the number of observations |
| occurring in each interval. |
F | Full analysis |
P | Partial analysis |
5-3 Terms Related to Biological Rhythm
Term/Abbreviation | Description |
|
|
|
Cosinor (Cosine Vector) | Circadian | rhythm | analysis | method |
| introduced by Halberg et al (1967). |
| ||
| In Cosinor, | |||
| on. Acrophase and Amplitude of Acrophase | |||
| are indicated on an |
| ||
| 95% confidence interval is used. If the | |||
| interval does not include the origin, the data | |||
| is interpreted that a statistically meaningful | |||
| rhythm exists. If the interval includes the origin, | |||
| the data is interpreted that the significance level | |||
| is 5% and the rhythm is rejected. |
| ||
MESOR | Indicates the | |||
(Midline Estimating Statistic of Rhythm) | value of the circadian rhythm, with no bias | |||
| due to the considerations on the difference | |||
| of the day and night sampling numbers, | |||
| and the difference of the day and night | |||
| sampling intervals. |
|
| |
| More accurate ABPM mean value when the | |||
| sampling intervals are not constant. |
| ||
Amp. Amplitude | Amplitude of a cosine curve best fitted to | |||
| the biological rhythm data. |
| ||
Acrophase | Phase that represents the maximum value | |||
| of a cosine curve best fitted to the biological | |||
| rhythm data. For example, an acrophase | |||
| indicates a time duration in which the | |||
| highest systolic blood pressure is obtained. | |||
|
|
| Continued | |
63