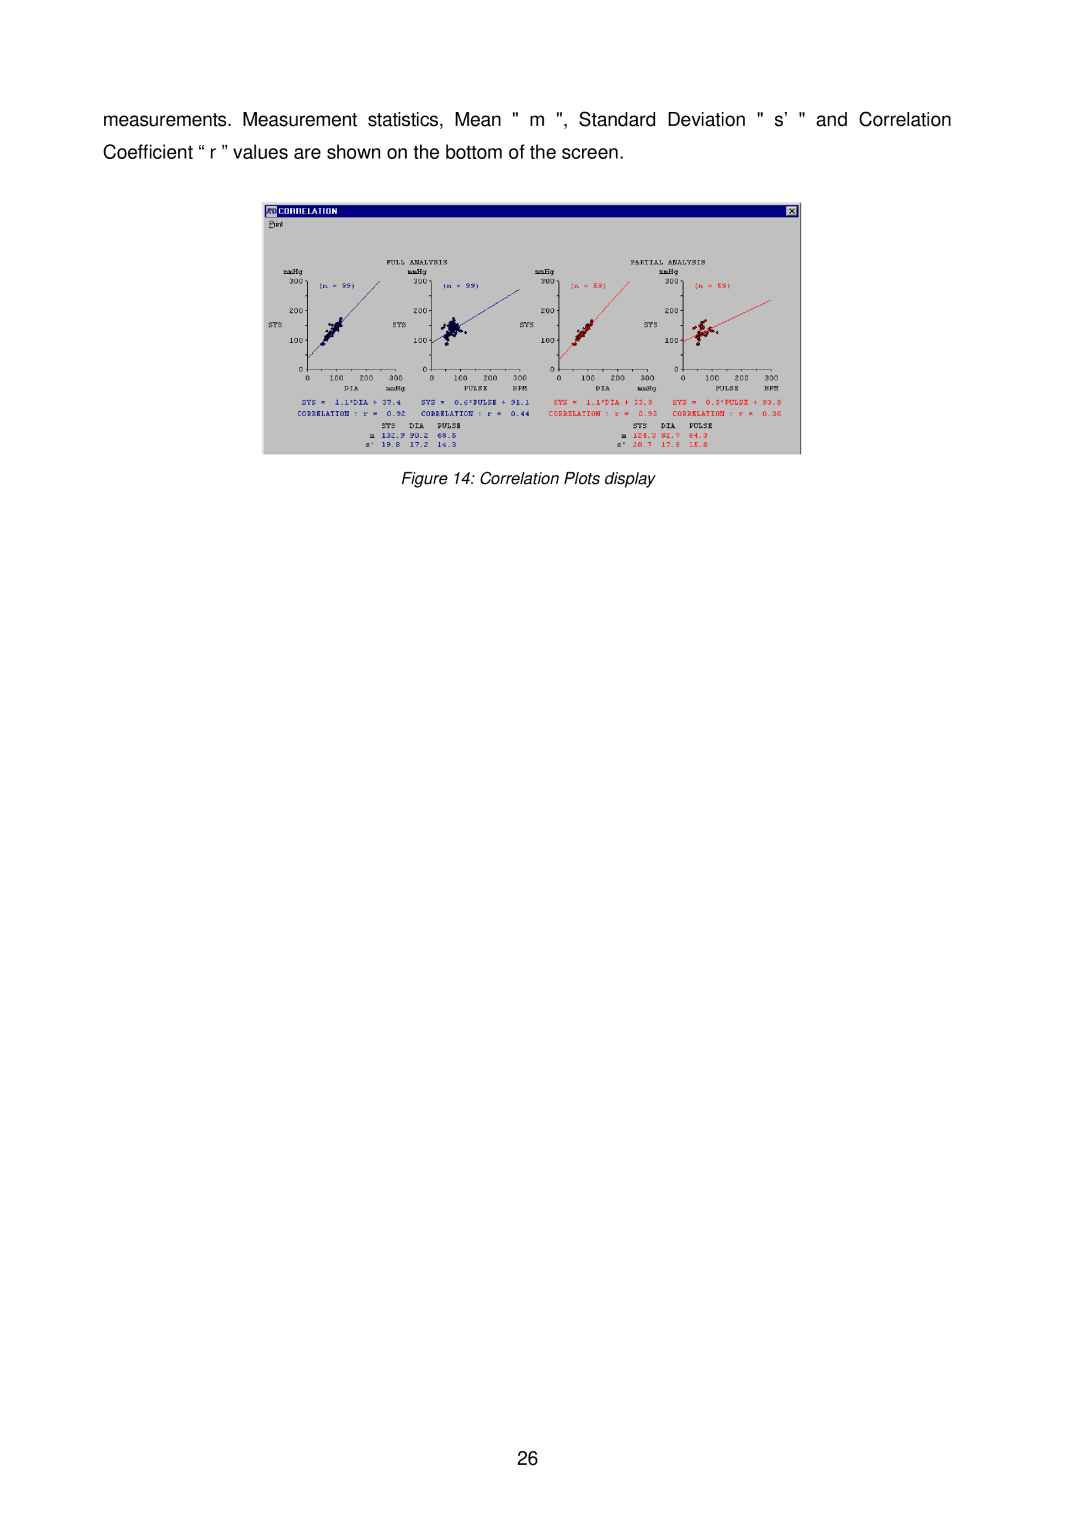
measurements. Measurement statistics, Mean " m ", Standard Deviation " s’ " and Correlation Coefficient “ r ” values are shown on the bottom of the screen.
Figure 14: Correlation Plots display
26
measurements. Measurement statistics, Mean " m ", Standard Deviation " s’ " and Correlation Coefficient “ r ” values are shown on the bottom of the screen.
26