Agilent E6474A
Wireless Network Optimization Platform
Manual Part Number
See this chapter For this information
About this guide
Connected to your vehicle
System specifications, including software
Recommendations for installing components
Information Hardware options, and part numbers
Contents
External antennas
E6473B high speed direct connect hub
Use Your System
Test 5 Phone testing using a test call
Troubleshooting your E6474A system
Setting an iDEN phone’s baud rate
Test 2 Receiver testing by measuring a known channel
Safety and Regulatory Information
E6452A Option 002/E6457C Japan cellular band receiver
E6458C GSM 850 receiver specifications
Index 181
Agilent E6474A User’s Guide
Unpacking your boxes
Get Ready
Before installing the software
To do this See this
What you’ll find in this chapter
What is on the CD
Do This
Install the E6474A software
Analysis Reporter option
Install Analysis Reporter software
To install the Adobe Reader software
Install Adobe Reader software
To view documents
Software option
Once the installation has
Completed
Uninstalling Existing Software
Uninstalling the Walkabout or VoicePrint software
Select Start button
Start the software and check you license options
Verifying your software installation
Agilent Wireless Solutions E6474A E6474A
An option will appear in your program listing
Options Connected a valid license dongle
Match your ordered license
Installing the Software
Overview
Set Up Your System
To do this Refer to
E6473B High Speed Direct Connect Hub
Your PC
How to connect the E6473B hub
Source
Refer to Figure
Power the E6473B hub from the in-vehicle lighter socket
How to power your E6473B hub
Powering the E6473B hub Refer to
Power E6473B hub directly from lighter socket
Power the E6473B hub using the in-vehicle chassis
Power to vehicle ignition system
Power the E6473B hub from a battery
How to connect other devices to the E6473B hub
How to connect a license key dongle to the E6473B hub
System component Refer to
Verifying E6473B hub installation
Connecting two direct connect hub systems
Direct connect hub connections
Connect and switch on the E6473B hub
Verifying installation using the Configuration Utility
Enable Use Digital Loopback option Select Begin Test
Select Start Settings Control Panel
Verifying Installation using the Device Manager
Direct serial port Pcmcia PC Card E6473B hub USB port
Phone connection using direct serial port
Phone connection using
Phones
Phone connection using the E6473B hub
Phone connection using Pcmcia PC Card
BC D
E6473-803
Phone connection using a USB port
External antennas
Use with phones Adapter part number Adapter type Number
Agilent Digital Receivers
Receiver configuration
Connect multiple receivers Pulse trigger the receivers
Serial port connection for Agilent digital receiver
Connect directly to your laptop
Connect two receivers to your in-vehicle E6473B hub
Connect to the E6473B hub
Connections for receiver
Receiver
To connect multiple receivers
Connect multiple receivers
Pulse trigger the receiver
Connecting more than one receiver to your laptop
Connecting the pulse trigger cable
Agilent digital receiver external GPS
GPS and GPS/DR configuration
GPS and GPS/DR
Agilent digital receiver internal GPS
Internal GPS with optional differential GPS
Example 2 Using Placer GPS
External GPS Placer
Example 3 Placer 455 with differential GPS
Placer 455 GPS with differential GPS
Agilent GPS/DR navigator
External GPS using the E6473B hub
Method 2 USB connection
Method 1 In-vehicle chassis
Method 3 Serial connection
Gyro positioning
Connecting the Speed Pulse
Color Connection
Indoor positioning
LEDs Lit Capacity Remaining
Charging the battery
Batteries
Checking the remaining charge
Safe handling and disposal
Set Up Your System
Portable system cable connections
Indoor Setup
Carry pack final assembly
Using carry pack assembly with the shoulder strap
Side view of the carry pack showing the shoulder strap
Using the carry pack as a backpack
Carry pack inside view
Portable digital receiver system
Chassis and backpack assembly
Single receiver backpack right side view
Final assembly
Portable dual E645xx receiver system
Using the single-receiver backpack
Cable routing within the backpack
Inside the backpack
Cable routing through the shoulder straps
Routing cables through the shoulder straps
Receiver and hub mounting
Cable connections to the receiver
Cable connections to the E6473B hub
Dual receiver backpack final assembly
Backpack exterior features
Tightening the shoulder straps on the backpack
Adjusting the backpack harness
Introduction
License Manager
For more information
Identifying devices
Use Your System
E6473B high speed direct connect hub
Battery charging
Agilent direct connect GPS/DR
LEDs and display during power-up
Determining GPS receiver status
Calibration of dead reckoning
To start the software
Starting the software
To check your license options
Confirm you license options
Creating a new project
To create a new plan
System Setup view
Identifying devices
Identify devices
System setup view showing pop-up menu
Enabling the devices
System Setup View with a phone identified on COM
To configure a device
Configuring devices and views
An example of a device properties dialog box
To configure measurement views
Use Your System
File type
File types and locations
Extension
Add a modem connection to the computer
Configuring and creating a data project
Configure the phone
Generic data devices
Testing the phone/modem configuration
Configure the network and dial-up connection
To add a device to the data port
Adding a data device
Data device added
Configuring data device properties
To configure a Wams sequence
Configuring and creating a Wams project Option
To start the Wams interface
Software Get information about
Learn to use
E6474A Quick Basics tutorial
Using Quick Basics the Online Tutorial
Reference Tutorial
To run the tutorial
After the Tutorial
Do this See this
Online Help
Accessing Online Help
Typical online help browser display
Getting familiar with new features
Using Online Help
Getting Information about Views
Using the contents tab
Using the index tab
Using the search tab
100
Service on
Solve problems with your system
Update E645xx receiver firmware
Return the system for service
Remedies
Troubleshooting your E6474A system
Device communication problems
Causes
Changing a Sagem phone’s operating mode
Setting an iDEN phone’s baud rate
Toshiba C-103T
Toshiba phone power-up issues
Toshiba direct-connect phone power-up
Toshiba 10-CT
Agilent E6474A User’s Guide 105
Preparing the hardware
Test 1 Receiver testing using a signal generator
Verifying your System
Overview
Agilent E6474A User’s Guide 107
Model
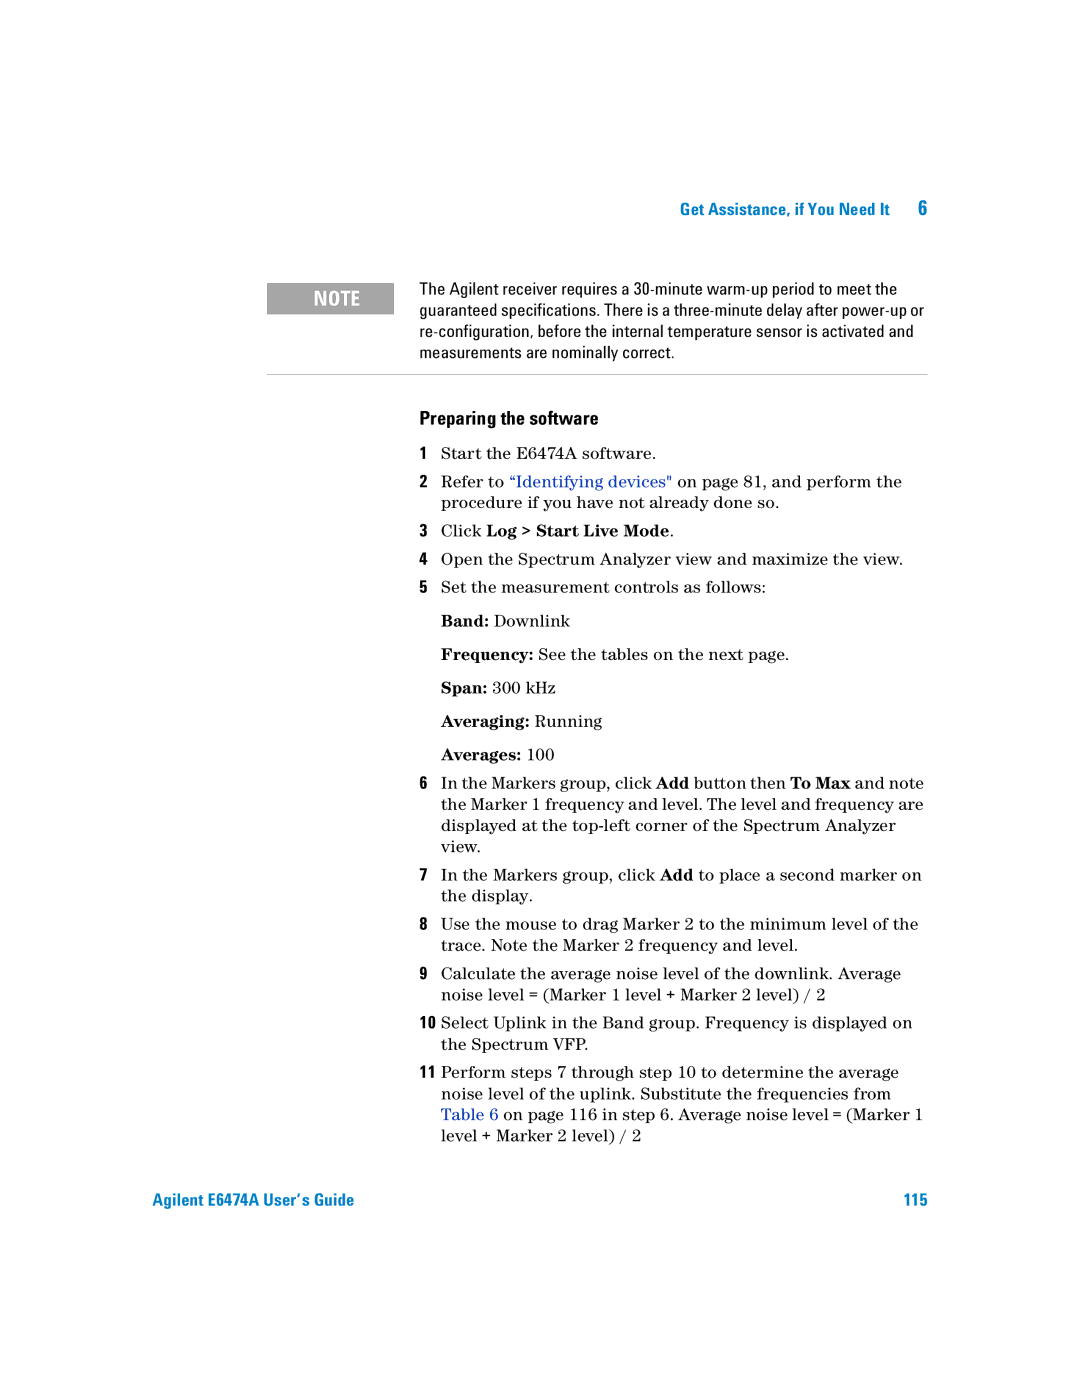
Preparing the software
MHz at -60 dBm
Testing the signal
Umts E6455C receivers Mhz at -60 dBm
Signal Generator Downlink Settings
Passing the test
Accuracy
Test 2 Receiver testing by measuring a known channel
Agilent E6474A User’s Guide 113
System Configuration for Measuring the Noise Floor
Test 3 Receiver testing by measuring the noise floor
Agilent E6474A User’s Guide 115
837 MHz
Test 4 GPS receiver testing
Model Marker 1 Frequency step
882 MHz
Setting up the hardware
Test 5 Phone testing using a test call
Testing the phone
Online Frequently Asked Questions
Updating E645xx Receiver Firmware
Firmware upgrade required, first dialog box
Agilent E6474A User’s Guide 121
Firmware update successful dialog box
Replacement firmware security key
Technical telephone assistance
Contacting Customer Support
Numbers to call
Warranty repair
Returning the System for Service
Do This Additional Information
Preparing the system for shipping
Retain copies of all shipping papers
General safety considerations
Safety and Regulatory Information
Safety and Regulatory Information
Installation, Use, and Storage
Productdamage
Signal and input power Symbols
11,2*11
Supplementary Information
Declaration of Conformity Agilent Direct Connect Hub
For this information See this
Reference Name Description or Cable Connection
Flashes when phone data is received
Flashes when phone data is transmitted
Direct Connect Hub front panel descriptions see Figure
Aux Auxiliary Data Port
Pwr Power Input connection Connect to main power cable
E645xx Receiver
Agilent High Speed Direct Connect GPS/DR Navigation
RS232/1PPS
Pwr Power Input
Front panel
Trimble Placer GPS 455DR
140
For this See this
Information/Requirements
Computer Hardware and Software Requirements
Item Description Specifications
Battery Specifications part of E6473B, options 022, 023,
Charger specifications part of E6473B Options 022, 023,
Battery disposal
Power cable
Description
E6473B High Speed Direct Connect Hub Specifications
E6450C CDMA/TDMA PCS 1.9 GHz receiver specifications
Receiver Specifications
Miscellaneous
Description Specification
Internal GPS‡ Option
To 50% relative humidity at 40C
E6451A/E6451C GSM900 receiver specifications
Internal GPS
Power options 300, 320 To 34 V DC, 9W
Option
E6452C CDMA/TDMA cellular band receiver specifications
Internal GPS** Option
100 240 Volts AC 50 60 Hz
Accuracy, 30 kHz if
Storage temperature range 40C to +70C
Accuracy, 1.25 MHz if
±3 dB from 40 dBm to 50 dBm 0 to 55C
Agilent E6474A User’s Guide 153
E6453C GSM1800 and Korean Cdma band receiver specifications
Internal GPS‡
E6454C 1.9 GHz CDMA/GSM1900 receiver specifications
Agilent E6474A User’s Guide 157
DBm for 1.25 MHz -115 dBm for 5 MHz
E6455C 2.1 GHz W-CDMA/UMTS/cdma2000 receiver specifications
Accuracy 1.25 MHz if
Accuracy, 5 MHz if
GPS Receiver Channel internal GPS receiver Connector type
E6456C 1.9 GHz W-CDMA/UMTS/cdma2000 receiver specifications
Differential compatible without dead reckoning
E6458C GSM 850 receiver specifications
Agilent E6474A User’s Guide 163
E7456C iDEN/CDMA RF receiver specifications
Agilent E6474A User’s Guide 165
To view a list of supported phones
Phone Support
Part Number Description
Options and Part Numbers
Cable part numbers
E6473B phone interface cable options
Antenna kit part numbers
Component Part Number Description
Agilent receivers
Hardware included with E6474A software licenses
Part Description
170
Computer mount
Antenna
Cables
Installation Guidelines
Permanent In-Vehicle Hardware Installation D
Mounting the E645x receiver
Direct Connect Hub Installation
Installation guidelines
Antenna Installation
GPS antenna
Cellular antennas
Computer mount installation
USB data cable
Cable Installation
Main power cable
Phone extender cables
Connecting the ignition sense lead to the fuse block
Power cable connections to the vehicle
Ignition sense lead
Speed Pulse Cable
180
Add a data device
Battery
Connection panels and LED indicators, 137 connections
How to connect a license key
Garmin II Plus GPS
Epf files
File types
Lost
Receivers Speed Pulse cable installation, 179 spf files
In-vehicle lighter socket, 28 Power-up
Sef files Set up your system
Battery Battery charger
VoicePrint, 15 VoicePrint uninstallation