Americas Headquarters
User Guide for Cisco Secure Access Control System
Page
Iii
N T E N T S
Rules-Based Service Selection
Configuring an Authorization Policy for Host Lookup Requests
My Account
Vii
Exporting Network Devices and AAA Clients
Viii
Failover
Radius Identity Store in Identity Sequence
Managing Access Policies
Maximum User Session in Distributed Environment
Xii
Creating and Editing Alarm Schedules
Xiii
Exporting Report Data
Xiv
Adding Groups
Filtering Chart Data
Xvi
Managing System Administrators
Xvii
Activating a Secondary Instance
Xviii
Configuring Logs
Xix
Using Log Targets
PKI Usage
Xxi
EAP-MSCHAPv2 B-30
Xxii
Revised April 17
Audience
Document Conventions
Related Documentation
Documentation Updates
Date Description
Store
Obtaining Documentation and Submitting a Service Request
Preface User Guide for Cisco Secure Access Control System
Overview of ACS
Introducing ACS
ACS 4.x and 5.3 Replication
ACS Distributed Deployment
Related Topics
Related Topic
ACS
ACS Licensing Model
ACS Management Interfaces
ACS Web-based Interface
ACS Command Line Interface
Hardware Models Supported by ACS
Config
ACS Programmatic Interfaces
ACS Web-based Interface,
OL-24201-01
Migrating from ACS 4.x to ACS
Migration Requirements
Overview of the Migration Process
Supported Migration Versions
Migration Requirements, Supported Migration Versions,
Before You Begin
Select System Administration Downloads Migration Utility
Downloading Migration Files
Migrating from ACS 4.x to ACS
Migrating from ACS 4.x to ACS
Functionality Mapping from ACS 4.x to ACS
Radius
Migrating from ACS 4.2 on Csacs 1120 to ACS
Common Scenarios in Migration
Radius VSA
VSA
Migrating Data from Other AAA Servers to ACS
Migrating from ACS 3.x to ACS
Migrating from ACS 4.x to ACS Common Scenarios in Migration
OL-24201-01
Overview of the ACS 5.x Policy Model
ACS 5.x Policy Model
Information in ACS 5.3 Policy Element
Term Description
Policy Terminology
Types of Policies,
Simple Policies
Rule-Based Policies
Types of Policies
Policy Type
Access Services
For Device Administration Hosts Wireless Devices
Access Service B Access Service C Access Service a
Access Service Templates
Radius and TACACS+ Proxy Services
Feature ACS
Identity Policy
Failure Options
Group Mapping Policy
Authorization Policy for Device Administration
Processing Rules with Multiple Command Sets
Simple Service Selection
Service Selection Policy
Exception Authorization Policy Rules
Simple Service Selection, Rules-Based Service Selection,
Access Services and Service Selection Scenarios
Rules-Based Service Selection
Example Policy Rule Table
First-Match Rule Tables
Column Description
Policy Results
Authorization Profiles for Network Access
Policy Conditions
Policies and Identity Attributes
Processing Rules with Multiple Authorization Profiles
Example of a Rule-Based Policy
Policies and Network Device Groups
Prerequisites
Flows for Configuring Services and Policies
Customizing a Policy, Configuring Access Service Policies,
Editing Access Services,
Step Action Drawer in Web Interface
Editing a Custom Session Condition,
Related Topics
OL-24201-01
Common Scenarios Using ACS
Overview of Device Administration
Session Administration
Command Authorization
Overview of Password-Based Network Access
Password-Based Network Access
TACACS+ Custom Services and Attributes
EAP-FAST-GTC EAP-MD5 Leap
RADIUS-PAP RADIUS-CHAP
PEAP-GTC
Protocol Action
Password-Based Network Access Configuration Flow
MAB Radius PAP
Radius Chap
EAP-FAST
Peap
EAP-MSCHAPv2 or EAP-GTC or both
Overview of Certificate-Based Network Access
Certificate-Based Network Access
Certificate-Based Network Access for EAP-TLS
Using Certificates in ACS
Before you Begin
EAP-TLS
User Guide for Cisco Secure Access Control System
Validating an Ldap Secure Authentication Connection
Agentless Network Access
Overview of Agentless Network Access
802.1x
Host Lookup
Use Cases Attribute
Authentication with Call Check
Process Service-Type Call Check
PAP/EAP-MD5 Authentication
For more information, see , Managing Policy Elements
Agentless Network Access Flow
Adding a Host to an Internal Identity Store
Configuring an Ldap External Identity Store for Host Lookup
Previous Step
Next Step
Creating an Access Service for Host Lookup,
Creating an Access Service for Host Lookup
Previous Steps
Managing Identity Attributes,
Click Save Changes
Configuring an Identity Policy for Host Lookup Requests
See Viewing Identity Policies, page 10-21, for details
Select Host Lookup and click OK
VPN Remote Network Access
See Customizing a Policy, page 10-4, for more information
Supported Identity Stores
Supported Authentication Protocols
RADIUS/PAP RADIUS/CHAP
LDAP-RADIUS/PAP
Supported VPN Clients
Supported VPN Network Access Servers
Configuring VPN Remote Access Service
ACS and Cisco Security Group Access
Creating Security Groups
Adding Devices for Security Group Access
Creating SGACLs
Configuring an Ndac Policy
Select Network Access, and check Identity and Authorization
Configuring EAP-FAST Settings for Security Group Access
Creating an Access Service for Security Group Access
Creating an Egress Policy
Creating an Endpoint Admission Control Policy
Creating a Default Policy
Radius and TACACS+ Proxy Requests
Tacplusacct
Supported Protocols
Tacplusauthor Tacplusauthen
TACACS+ Body Encryption
Supported Radius Attributes
Connection to TACACS+ Server
PAP Ascii Chap
Configuring Proxy Service
Field Description
Welcome
My Workspace Welcome
My Account
Task Guides
Logging In, Logging Out,
Using the Web Interface
Accessing the Web Interface
Logging
Logging Out
Understanding the Web Interface
Navigation Pane, Content Area,
Header, Navigation Pane, Content Area,
Web Interface Design
Header
Drawer Function
Navigation Pane
Header, Content Area,
Content Area
Web Interface Location
Deleted item
Button or Field Description
Sorting
Filtering
Secondary Windows
Secondary Window
Transfer Boxes
Transfer Box Fields and Buttons
Schedule Boxes
Rule Table Pages
See Displaying Hit Counts, page 10-10for more information
Option Description
Supported ACS Objects, Creating Import Files,
Supported ACS Objects
ACS 5.x Policy Model
Property Name Property Data Type
Uments
Creating Import Files
Understanding the CSV Templates
Downloading the Template from the Web Interface
Click File Operations
Click Download Add Template
Header Field Description
Creating the Import File
Updating the Records in the ACS Internal Store
Deleting Records from the ACS Internal Store
Concurrency Conflict Errors
Common Errors
Deletion Errors
Display and Readability Features
Accessibility
System Failure Errors
Obtaining Additional Accessibility Information
Keyboard and Mouse Features
Step No Task Drawer Refer to
Configuring Minimal System Setup
Configuring Authentication
Configuring Local Server
Settings for Administrators
Configuring Administrator
Step No Task Drawer Refer to
Task Drawer Refer to
Configuring ACS to Manage Access Policies
Settings,
Configuring System Alarm
Understanding Alarm
Duplicating Alarm
OL-24201-01
External Servers
Managing Network Resources
Choose Network Resources Network Device Groups
Network Device Groups
Creating, Duplicating, and Editing Network Device Groups
Deleting Network Device Groups
Field Description
Deleting Network Device Groups from a Hierarchy
Network Devices and AAA Clients
See Displaying Network Device Properties,
Viewing and Performing Bulk Operations for Network Devices
Choose Network Resources Network Devices and AAA Clients
Network Device page appears
Exporting Network Devices and AAA Clients
Performing Bulk Operations for Network Resources and Users
Managing Network Resources Network Devices and AAA Clients
Creating, Duplicating, and Editing Network Devices
Exporting Network Resources and Users
Configuring Network Device and AAA Clients
TACACS+
SGT
KEK
Displaying Network Device Properties
TACACS+
Security Group
Access
Access Advanced Settings
Deleting Network Devices
Configuring a Default Network Device
About creating network device groups
Choose Network Resources External Proxy Servers
Working with External Proxy Servers
Creating, Duplicating, and Editing External Proxy Servers
Choose to create Radius proxy server
Deleting External Proxy Servers
OL-24201-01
Internal Identity Stores
Overview
Ldap
External Identity Stores
Identity Groups
Certificate-Based Authentication
Identity Stores with Two-Factor Authentication
Identity Sequences
Managing Internal Identity Stores
Authentication Information
Click File Operations to
Creating Identity Groups
Select Users and Identity Stores Identity Groups
Standard Attributes, User Attributes, Host Attributes,
Managing Identity Attributes
Deleting an Identity Group
Attribute Description
Standard Attributes
User Attributes
Host Attributes
Configuring Authentication Settings for Users
Choose System Administration Users Authentication Settings
Options Description
Password History
Creating Internal Users
Option
Defined under System Administration Users Authentication
Resources and Users,
Identity Stores Internal Identity Stores Users
Administration Users Authentication Settings
Mon dd hhmmss UTC YYYY, where
Deleting Users from Internal Identity Stores
Internal Users page appears without the deleted users
Creating Hosts in Identity Stores
Hhmmss UTC Yyyy , where
Deleting Internal Hosts
Configuring Users or Hosts for Management Hierarchy
Configuring AAA Devices for Management Hierarchy
Management Hierarchy
Attributes of Management Hierarchy
Configuring and Using UserIsInManagement Hierarchy Attribute
Related Topics
Ldap Overview
Managing External Identity Stores
Authentication Using Ldap
Directory Service
Configuring Ldap Groups, Viewing Ldap Attributes,
Multiple Ldap Instances
Ldap Connection Management
Authenticating a User Using a Bind Connection
Failover
Attributes Retrieval
Group Membership Information Retrieval
Creating External Ldap Identity Stores
Certificate Retrieval
Configuring an External Ldap Server Connection
Ldap Server Connection
Configuring External Ldap Directory Organization
Schema
If the tree containing subjects is the base DN, enter
External identity store you created is saved
Deleting External Ldap Identity Stores
Configuring Ldap Groups
Viewing Ldap Attributes
Leveraging Cisco NAC Profiler as an External MAB Database
Click Server
Ldap Interface Configuration in NAC Profiler
Advanced Options Active Response Delay
Click Save Profile
Configuring Endpoint Profiles in NAC Profiler
Edit NAC Profiler Definition General
Click the Server Connection tab
Test Bind to Server Dialog Box
Click Test Configuration
Number of Subjects Number of Directory Groups
Microsoft AD
Supported Authentication Protocols
User Guide for Cisco Secure Access Control System
Protocol Port number
Machine Authentication
Group Retrieval for Authorization
Attribute Retrieval for Authorization
Certificate Retrieval for EAP-TLS Authentication
Concurrent Connection Management
Machine Access Restrictions
Callback Options for Dial-in users
Machine Authentication AD Group Required ATZ profile
Dial-in Permissions
ACS Response
Dial-in Support Attributes
Joining ACS to an AD Domain
Configuring an AD Identity Store
Machine Authentication, page B-34
Click
Selecting an AD Group
Selecting an AD Group, Configuring AD Attributes,
Configuring AD Attributes
Available from the Attributes secondary window only
Joining ACS to Domain Controllers
RSA SecurID Server
Configuring RSA SecurID Agents
PIN
Creating and Editing RSA SecurID Token Servers
RSA Realm Settings Tab
Enable the RSA options file, Reset Agent Files,
Configuring ACS Instance Settings
Reset Agent Files
Enable the RSA options file
Check the Enable identity caching check box
Configuring Advanced Options
Radius PAP TACACS+ ASCII/PAP
Supported Authentication Protocols
Radius Identity Stores
Groups and Attributes Mapping
Password Prompt
User Group Mapping
Cause of Authentication Failure Failure Cases
Authentication Failure Messages
Radius Identity Store in Identity Sequence
Username Special Format with Safeword Server
Radius PAP TACACS+ ASCII\PAP
User Attribute Cache
Creating, Duplicating, and Editing Radius Identity Servers
Configuring General Settings
Server Connection
Configuring Shell Prompts
Cisco-av-pair.some-avpair
Configuring Directory Attributes
Configuring Shell Prompts, Configuring Advanced Options,
Configuring CA Certificates
Select Users and Identity Stores Certificate Authorities
Adding a Certificate Authority
Description of the certificate
Deleting a Certificate Authority
Exporting a Certificate Authority
Configuring Certificate Authentication Profiles
Certificate Authentication Profile page reappears
Authentication Sequence
Configuring Identity Store Sequences
Creating, Duplicating, and Editing Identity Store Sequences
Attribute Retrieval Sequence
22 Identity Store Sequence Properties
Deleting Identity Store Sequences
OL-24201-01
OL-24201-01
Managing Policy Conditions
Managing Policy Elements
Managing Policy Elements Managing Policy Conditions
Select Policy Elements Session Conditions Date and Time
Deleting a Session Condition, Managing Network Conditions,
Policy,
Select Policy Elements Session Conditions Custom
Managing Network Conditions
Deleting a Session Condition
Managing Policy Elements Managing Policy Conditions
Importing Network Conditions
Creating, Duplicating, and Editing End Station Filters
Exporting Network Conditions
Defining IP Address-Based End Station Filters
Defining CLI or DNIS-Based End Station Filters
Defining MAC Address-Based End Station Filters
Creating, Duplicating, and Editing Device Filters
Defining Name-Based Device Filters
Defining IP Address-Based Device Filters
Defining NDG-Based Device Filters
Creating, Duplicating, and Editing Device Port Filters
Defining IP Address-Based Device Port Filters
Defining Name-Based Device Port Filters
Defining NDG-Based Device Port Filters
Managing Authorizations and Permissions
Authorization Profiles
Specifying Common Attributes in Authorization Profiles
Specifying Authorization Profiles
Vlan ID/Name Includes a Vlan assignment
Attribute, its name, value, and type appear in the table. To
Specifying Radius Attributes in Authorization Profiles
Dictionary
Creating Security Groups,
Creating and Editing Security Groups
Related Topics
Defining Common Tasks, Defining Custom Attributes,
Defining General Shell Profile Properties
Defining Common Tasks
Privilege Level
Shell Profile Common Tasks
Replace
Defining Custom Attributes
OL-24201-01
Duplicated
Show
Creating, Duplicating, and Editing Downloadable ACLs
Appears without the deleted object
Deleting an Authorizations and Permissions Policy Element
Configuring Security Group Access Control Lists
OL-24201-01
10-1
Policy Creation Flow
10-2
Network Definition and Policy Goals
Policy Creation Flow-Next Steps
Policy Creation Flow-Previous Step
Policy Elements in the Policy Creation Flow
Network Definition and Policy Goals,
10-3
Service Selection Policy Creation
Access Service Policy Creation
Customizing a Policy
10-4
10-5
Configuring the Service Selection Policy
Configuring a Policy-Next Steps
Service Selection Policy
Configuring a Simple Service Selection Policy
Select Access Policies Service Selection Policy
10-6
10-7
See Displaying Hit Counts,
10-8
Creating, Duplicating, and Editing Service Selection Rules
Select Access Policies Service Selection Policy. If you
10-9
Conditions
10-10
Deleting Service Selection Rules
Displaying Hit Counts
10-11
Configuring Access Services
Editing Default Access Services
10-12
Creating, Duplicating, and Editing Access Services
Select Access Policies Access Services
10-13
Configuring General Access Service Properties
10-14
10-15
Configuring Access Service Allowed Protocols
Select Access Policies Access Services, then click
10-16
Server Certificates, page 18-14for more information
10-17
10-18
10-19
Configuring Access Services Templates
Access Service
Deleting an Access Service
Type Protocols Policies Conditions Results
10-20
10-21
Configuring Access Service Policies
Viewing Identity Policies
10-22
10-23
Viewing Rules-Based Identity Policies
10-24
Configuring Identity Policy Rule Properties
10-25
10-26
Configuring a Group Mapping Policy
10-27
Displaying Hit Counts,
10-28
Configuring Group Mapping Policy Rule Properties
10-29
Select Access Policies Access Services service Authorization
10-30
10-31
Configuring Network Access Authorization Rule Properties
10-32
Configuring Device Administration Authorization Policies
10-33
10-34
Condition
10-35
Configuring Authorization Exception Policies
10-36
Condition Name
10-37
Creating Policy Rules
10-38
Duplicating a Rule
Editing Policy Rules
10-39
Deleting Policy Rules
10-40
Configuring Compound Conditions
Compound Condition Building Blocks
Operand1 Operand2 Example
Types of Compound Conditions
Atomic Condition
10-41
10-42
Single Nested Compound Condition
Multiple Nested Compound Condition
10-43
Compound Expression with Dynamic value
10-44
Using the Compound Expression Builder
Egress Policy Matrix
Security Group Access Control Pages
Policy Matrix,
Policy Page,
Creating an Egress Policy, Creating a Default Policy,
Defining a Default Policy for Egress Policy
Editing a Cell in the Egress Policy Matrix
Creating an Egress Policy,
Simple Policy
Ndac Policy
Rule-Based Policy
10-47
10-48
Configuring an Ndac Policy, Ndac Policy Properties Page,
Ndac Policy Properties
10-49
Configuring an Ndac Policy, Ndac Policy Page,
10-50
Network Device Access EAP-FAST Settings
Maximum User Sessions
10-51
Max Session User Settings
Max Session Group Settings
10-52
Max Session Global Setting
Max User Session Global Settings
10-53
Go to System Administration Users Purge User Sessions
Purging User Sessions
10-54
Maximum User Session in Distributed Environment
Click Get Logged-in User List
10-55
Maximum User Session in Proxy Scenario
10-56
11-1
Logging monitor informational Logging origin-id ip
Epm logging
Authentication Records and Details,
Authentication Records and Details
Dashboard Pages
11-2
11-3
11-4
Working with Portlets
11-5
Working with Authentication Lookup Portlet
Running Authentication Lookup Report
Configuring Tabs in the Dashboard
Dashboard Pages, Running Authentication Lookup Report,
Adding Tabs to the Dashboard
11-7
Renaming Tabs in the Dashboard
Adding Applications to Tabs
Deleting Tabs from the Dashboard
Changing the Dashboard Layout
Click Manage Pages
11-8
Threshold Alarms, System Alarms,
Understanding Alarms
Threshold Alarms
12-1
System Alarms
Evaluating Alarm Thresholds
Evaluating Alarm Thresholds, Notifying Users of Events,
Evaluation Cycle1
12-3
Viewing and Editing Alarms in Your Inbox
Notifying Users of Events
12-4
Alarm Severity
12-5
12-6
12-7
12-8
Select Monitoring and Reports Alarms Inbox
Creating and Editing Alarm Schedules
Understanding Alarm Schedules
Choose Monitoring and Reports Alarms Schedules
12-9
12-10
Assigning Alarm Schedules to Thresholds
Choose Monitoring and Reports Alarms Thresholds
Deleting Alarm Schedules
Creating, Editing, and Duplicating Alarm Thresholds
Select Monitoring and Reports Alarms Thresholds
12-11
12-12
12-13
Configuring General Threshold Information
Passed Authentications
Configuring Threshold Criteria
Passed Authentication Count
ACS Instance
12-15
Failed Authentication Count
Failed Authentications
Device IP
12-16
12-17
12-18
Authentication Inactivity
12-19
Tacacs Command Accounting
12-20
Tacacs Command Authorization
12-21
ACS Configuration Changes
12-22
ACS System Diagnostics
12-23
ACS Process Status
12-24
ACS System Health
CPU
12-25
ACS AAA Health
12-26
Radius Sessions
12-27
Count of Unknown NAD Authentication Records
Unknown NAD
12-28
External DB Unavailable
12-29
Rbacl Drops
DGT
NAD
Dstip
12-30
12-31
NAD-Reported AAA Downtime
Device IP Count of NAD-Reported AAA Down Events
12-32
Configuring Threshold Notifications
12-33
Deleting Alarm Thresholds
12-34
Configuring System Alarm Settings
12-35
Understanding Alarm Syslog Targets
Creating and Editing Alarm Syslog Targets
12-36
Deleting Alarm Syslog Targets
13-1
Managing Reports
13-2
Catalog-Monitoring & Reports Reports Catalog reporttype
Adding Reports to Your Favorites
Working with Favorite Reports
Click Add to Favorites
13-3
Click Add to Favorite
Viewing Favorite-Report Parameters
Choose Monitoring and Reports Reports Favorites
13-4
Running Favorite Reports
Editing Favorite Reports
Select Monitoring & Reports Reports Favorites
13-5
Deleting Reports from Favorites
Sharing Reports
Click Launch Interactive Viewer for more options
Reports Reports Catalog ACS Instance
Available Reports in the Catalog
Working with Catalog Reports
Report Name Description Logging Category
13-7
13-8
13-9
13-10
13-11
Running Catalog Reports
13-12
13-13
Deleting Catalog Reports
Running Named Reports
13-14
Reporttype Reportname
13-15
Understanding the ReportName
13-16
13-17
13-18
Enabling Radius CoA Options on a Device
Radius Active Session Report
13-19
Restoring Reports
Customizing Reports
Click Launch Interactive Viewer
13-20
About Standard Viewer
Viewing Reports
About Interactive Viewer
About Interactive Viewer’s Context Menus
Context Menu for Column Data in Interactive Viewer
13-22
Navigating Reports
Using the Table of Contents
13-24
Exporting Report Data
12 The Export Data Dialog Box
13-25
13-26
Printing Reports
Saving Report Designs in Interactive Viewer
13-27
Formatting Reports in Interactive Viewer
Editing Labels
Formatting Data
Formatting Labels
Resizing Columns
Select Change Text
Formatting Data in Columns
Changing Column Data Alignment
Formatting Data in Aggregate Rows
Select Style Font
13-30
Formatting Data Types
Data type Option Description
13-31
Formatting Numeric Data
Formatting Custom Numeric Data
Formatting Fixed or Scientific Numbers or Percentages
Data in the data set Result of formatting
13-32
Formatting String Data
Symbol
Formatting Custom String Data
13-33
13-34
Formatting Date and Time
Data in the data source Results of formatting
Format Result of formatting
Formatting Custom Date and Time
Mmmm
13-35
13-36
Formatting Boolean Data
Applying Conditional Formats
13-37
Setting Conditional Formatting for Columns
Select Style Conditional Formatting
19 Comparison Value Field
13-38
13-39
Deleting Conditional Formatting
13-40
Setting and Removing Page Breaks in Detail Columns
Setting and Removing Page Breaks in a Group Column
13-41
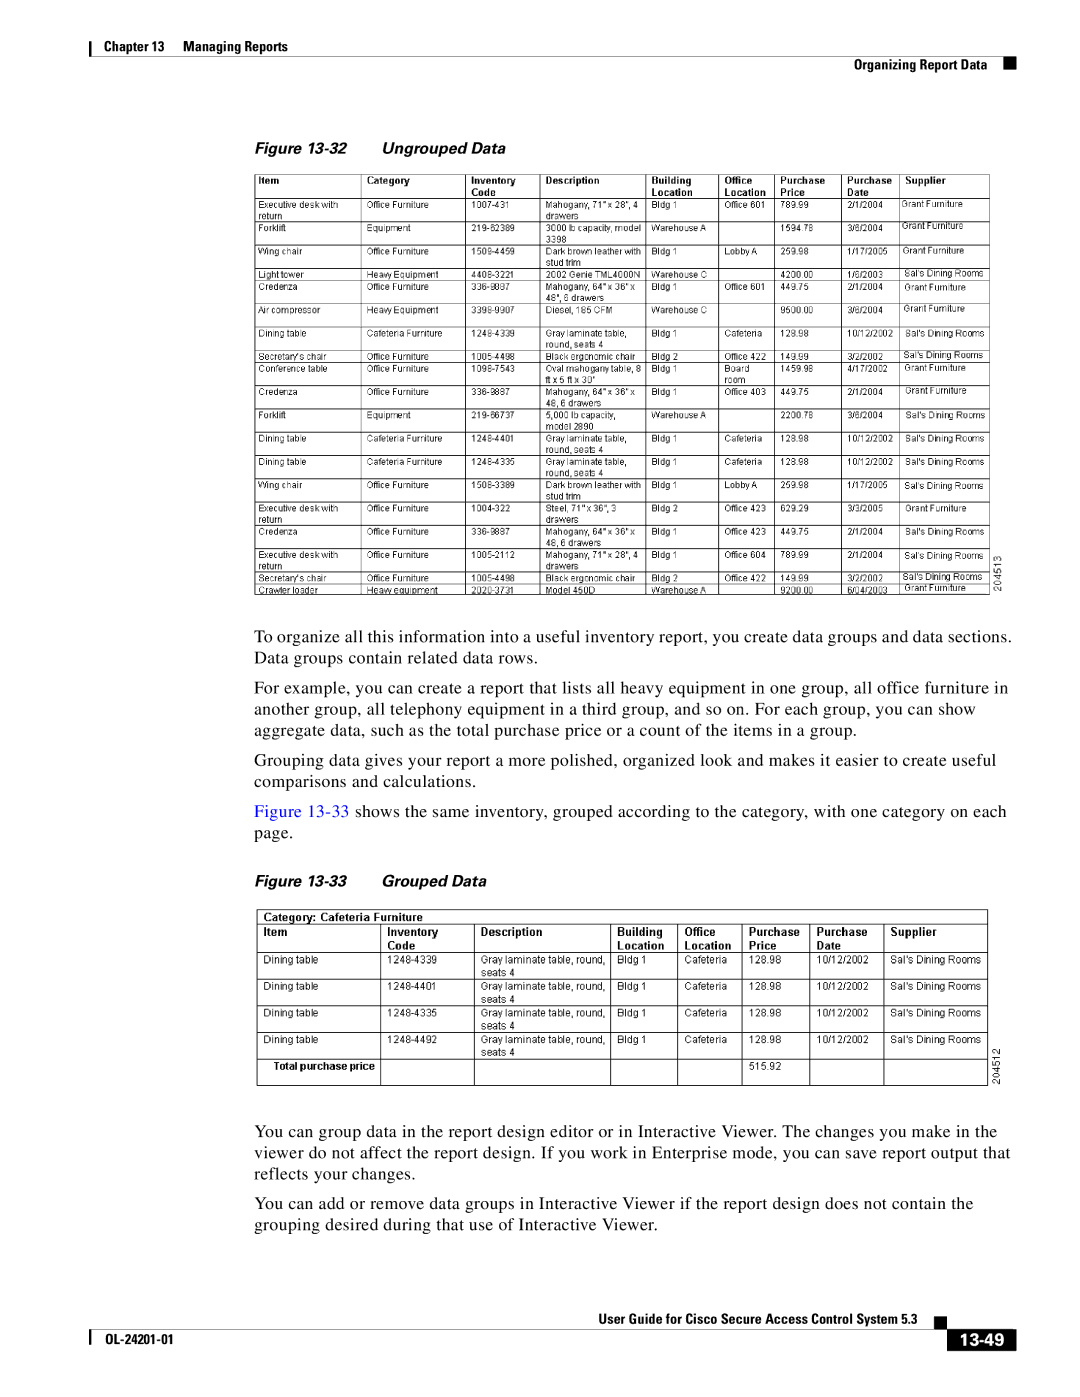
Organizing Report Data
Displaying and Organizing Report Data
13-42
Reordering Columns in Interactive Viewer
Select Column Move to Group Header
13-43
Removing Columns
Hiding Columns
Hiding or Displaying Report Items
Select Hide or Show Items
Select Column Hide Column
Merging Columns
Displaying Hidden Columns
Select Column Show Columns
13-45
13-46
Selecting a Column from a Merged Column
Select Column Merge Columns
Sorting a Single Column
Sorting Data
Sorting Multiple Columns
Sorting a Single Column, Sorting Multiple Columns,
13-48
Grouping Data
13-49
13-50
Adding Groups
Grouping Data Based on Date or Time
13-51
Removing an Inner Group
Creating Report Calculations
37 Calculated Column
13-52
13-53
Understanding Supported Calculation Functions
Function Description Example of use
13-54
Count
Countdistinct
13-55
Isbottomnpercent
13-56
13-57
Movingaverage
13-58
Today
13-59
Weightedaverage
Understanding Supported Operators
Using Numbers and Dates in an Expression
Operator Description
13-60
Adding Days to an Existing Date Value
Using Multiply Values in Calculated Columns
Select Add Calculation
13-61
13-62
Working with Aggregate Data
Subtracting Date Values in a Calculated Column
13-63
Aggregate functions Description
13-64
Creating an Aggregate Data Row
13-65
Adding Additional Aggregate Rows
Click Add aggregation
Deleting Aggregate Rows
Hiding and Filtering Report Data
Hiding or Displaying Column Data
13-66
13-67
Displaying Repeated Values
Hiding or Displaying Detail Rows in Groups or Sections
13-68
Working with Filters
Condition Description
13-69
Types of Filter Conditions
13-70
Setting Filter Values
13-71
Creating Filters
13-72
Modifying or Clearing a Filter
Creating a Filter with Multiple Conditions
13-73
Click Advanced Filter
Click Add Condition
13-74
Filtering Highest or Lowest Values in Columns
13-75
Understanding Charts
13-76
Modifying Charts
Filtering Chart Data
Changing Chart Formatting
Changing Chart Subtype
Select Chart Subtype
13-77
13-78
50 Chart Formatting Options
Connectivity Tests
Available Diagnostic and Troubleshooting Tools
ACS Support Bundle
14-1
14-2
Expert Troubleshooter
Performing Connectivity Tests
Diagnostic Tool Description
See Comparing Sgacl Policy Between a Network Device and ACS
ACS-Assigned SGT Records, page 14-14for more information
14-4
Downloading ACS Support Bundles for Diagnostic Information
14-5
Working with Expert Troubleshooter
14-6
Troubleshooting Radius Authentications
NAS IP
14-7
14-8
Click Show Results Summary
14-9
Executing the Show Command on a Network Device
14-10
Evaluating the Configuration of a Network Device
AAA
14-11
Comparing Sgacl Policy Between a Network Device and ACS
SGA
14-12
Comparing the SXP-IP Mappings Between a Device and its Peers
14-13
Click the User Input Required button
VRF
14-14
14-15
Comparing Device SGT with ACS-Assigned Device SGT
14-16
15-1
15-2
15-3
Configuring Data Purging and Incremental Backup
15-4
15-5
15-6
Configuring NFS stagging
Configuring Data Purging and Incremental Backup,
Restoring Data from a Backup
Viewing Log Collections
15-7
15-8
Log Collection Details Page,
15-9
Log Collection Details
15-10
15-11
Recovering Log Messages
Viewing Scheduled Jobs
15-12
15-13
Viewing Process Status
Viewing Failure Reasons
Viewing Data Upgrade Status
Editing Failure Reasons
Failure Reasons Editor
Configuring Snmp Preferences
Specifying E-Mail Settings
Email Settings
15-15
15-16
Understanding Collection Filters
Creating and Editing Collection Filters
Configuring Remote Database Settings
Configuring Alarm Syslog Targets
Deleting Collection Filters
15-17
15-18
16-1
Managing System Administrators
16-2
Understanding Administrator Roles and Accounts
Understanding Authentication
Configuring System Administrators and Accounts
Understanding Roles
16-3
Predefined Roles
Permissions
Role Privileges
16-4
16-5
Changing Role Associations
16-6
Administrator Accounts and Role Association
Choose System Administration Administrators Accounts
16-7
Viewing Predefined Roles
Choose System Administration Administrators Roles
Viewing Role Properties
Button and click View
16-9
Configuring Authentication Settings for Administrators
16-10
Configuring Administrator Access Settings
Configuring Session Idle Timeout
Choose System Administration Administrators Settings Access
Allow All IP Addresses to Connect
16-12
Resetting the Administrator Password
Access-setting accept-all
Changing Your Own Administrator Password
Changing the Administrator Password
Choose My Workspace My Account
16-13
16-14
Resetting Another Administrator’s Password
17-1
Configuring System Operations
Understanding Distributed Deployment
Service Port
Aaa-server radius-authport
17-2
Removing Secondary Servers
Activating Secondary Servers
Activating Secondary Servers,
17-3
Promoting a Secondary Server
Understanding Local Mode
Understanding Distributed Deployment,
17-4
17-5
Specifying a Hardware Replacement
Understanding Full Replication
Creating, Duplicating, and Editing Scheduled Backups
Scheduled Backups
Creating, Duplicating, and Editing Scheduled Backups,
Choose System Administration Operations Scheduled Backups
17-7
Backing Up Primary and Secondary Instances
Backing Up Primary and Secondary Instances,
17-8
Editing Instances
Viewing and Editing a Primary Instance
17-9
Ddmmyyyy
17-10
GUI
17-11
Deleting a Secondary Instance
Viewing and Editing a Secondary Instance
Editing Instances, Viewing and Editing a Primary Instance,
17-12
Registering a Secondary Instance to a Primary Instance
Activating a Secondary Instance
Click Activate
17-13
17-14
17-15
Click Register to Primary
17-16
Click Deregister
Click Deregister from Primary
17-17
17-18
Replicating a Secondary Instance from a Primary Instance
17-19
Click Full Replication
17-20
See Registering a Secondary Instance to a Primary Instance,
17-21
Failover
17-22
Click Request Local Mode
17-23
17-24
Configuring TACACS+ Settings
Configuring Global System Options
Manage licensing. See Licensing Overview,
18-1
18-2
Configuring EAP-TLS Settings
Configuring EAP-FAST Settings
Configuring Peap Settings
Generating EAP-FAST PAC,
18-3
Generating EAP-FAST PAC
Configuring RSA SecurID Prompts
Click Generate PAC
Tokencode
Viewing Radius and TACACS+ Attributes
Managing Dictionaries
YOU Prepared to Accept a SYSTEM-GENERATED PIN?
Radius Ietf
18-6
Radius VSAs, page A-6
18-7
Viewing Radius and TACACS+ Attributes,
18-8
18-9
Viewing Radius Vendor-Specific Subattributes
18-10
Configuring Identity Dictionaries
18-11
Configuring Internal Identity Attributes
18-12
Deleting an Internal User Identity Attribute
Policy Elements Session Conditions Custom
18-13
Deleting an Internal Host Identity Attribute
18-14
Configuring Local Server Certificates
Adding Local Server Certificates
18-15
Associating Certificates to Protocols,
Signing Request,
EAP
Generating Self-Signed Certificates
Select Generate Self Signed Certificate Next
18-16
Binding CA Signed Certificates
Generating a Certificate Signing Request
Select Generate Certificate Signing Request Next
Click Finish
18-18
Editing and Renewing Certificates
Select Bind CA Signed Certificate Next
18-19
Deleting Certificates
18-20
Exporting Certificates
Viewing Outstanding Signing Requests
18-21
Configuring Logs
Configuring Remote Log Targets
General
Target Configuration
Deleting a Remote Log Target,
18-22
Configuring Remote Log Targets,
Configuring the Local Log
Deleting a Remote Log Target
Deleting Local Log Data
Configuring Global Logging Categories
Configuring Logging Categories
Option Descriptions
18-24
18-25
18-26
Category Log and Description
18-27
18-28
Show logging system
18-29
Configuring Per-Instance Logging Categories
Configuring Per-Instance Security and Log Settings,
18-30
Configuring Per-Instance Security and Log Settings
Configure Logged Attributes
Configuring Per-Instance Remote Syslog Targets
Click the Remote Syslog Target tab
18-31
18-32
Displaying Logging Categories
18-33
Configuring the Log Collector
Viewing the Log Message Catalog
Types of Licenses
Licensing Overview
License Description
18-34
18-35
Installing a License File
18-36
Viewing the Base License
PAK
18-37
Upgrading the Base Server License
Upgrading the Base Server License,
18-38
Viewing License Feature Options
18-39
Adding Deployment License Files
Available Downloads
Deleting Deployment License Files
Click Delete to delete the license file
18-40
Downloading Migration Utility Files
Downloading UCP Web Service Files
Downloading Sample Python Scripts
18-41
18-42
Downloading Rest Services
Choose System Administration Downloads Rest Service
19-1
About Logging
About Logging, ACS 4.x Versus ACS 5.3 Logging,
19-2
Using Log Targets
Logging Categories
19-3
19-4
Global and Per-Instance Logging Categories
Log Message Severity Levels
19-5
Local Store Target
ACS Severity Syslog Severity Level Description
19-6
19-7
Critical Log Target
19-8
Remote Syslog Server Target
19-9
19-10
Monitoring and Reports Server Target
Viewing Log Messages
19-11
Debug Logs
19-12
ACS 4.x Versus ACS 5.3 Logging
CSV
19-13
Use the System Configuration Logging
Use the Reports and Activity pages
19-14
Typical Use Cases
Device Administration TACACS+
Session Access Requests Device Administration TACACS+
Network Access Radius With and Without EAP
Command Authorization Requests
PAP Chap
RADIUS-Based Flows with EAP Authentication
RADIUS-Based Flow Without EAP Authentication
PEAP/EAP-GTC
EAP-FAST/EAP-GTC
Figure A-3shows a RADIUS-based authentication with EAP
Point of Comparison
Access Protocols-TACACS+ and Radius
Overview of TACACS+
Radius VSAs
Overview of Radius
ACS 5.3 as the AAA Server
Address IP Integer Time
Radius Attribute Support in ACS
Authentication
Radius Access Requests
Authorization
Accounting
OL-24201-01
Authentication and User Databases
Authentication Considerations
EAP-MSCHAPv2, page B-30
PAP, page B-2 CHAP, page B-31
EAP
Radius PAP Authentication
EAP Method Description
EAP message type EAP code
Information see EAP-MSCHAPv2, page B-30
EAP-GTC
EAP- MD5 Flow in ACS
Host Lookup, Overview of Agentless Network Access,
Overview of EAP-MD5
Overview of EAP-TLS
User Certificate Authentication
PKI Authentication
PKI Usage
PKI Credentials
Importing Trust Certificates
Acquiring Local Certificates
Fixed Management Certificates
Certificate Generation
Importing the ACS Server Certificate
Initial Self-Signed Certificate Generation
Exporting Credentials
Securing the Cryptographic Sensitive Material
Hardware Replacement and Certificates
Credentials Distribution
EAP-TLS Flow in ACS
Private Keys and Passwords Backup
Overview of PEAP, page B-15 EAP-MSCHAPv2, page B-30
PEAPv0/1
Overview of Peap
Supported Peap Features
Fast Reconnect
Creating the TLS Tunnel
Peap Flow in ACS
Overview of EAP-FAST
Authenticating with MSCHAPv2
EAP-FAST
EAP-FAST Benefits
EAP-FAST in ACS
About PACs
About Master-Keys
Types of PACs
Provisioning Modes
Automatic In-Band PAC Provisioning
Proactive PAC Update
ACS-Supported Features for PACs
Machine PAC Authentication
PAC-Less Authentication
Accept Peer on Authenticated Provisioning
PAC Type Tunnel v1/v1a/SGA Machine Authorization
PAC
EAP-FAST for Allow TLS Renegotiation
EAP-FAST Flow in ACS
Master Key Generation and PAC TTLs
EAP-FAST PAC Management
Revocation Method
Key Distribution Algorithm
EAP-FAST PAC-Opaque Packing and Unpacking
PAC Migration from ACS
EAP Authentication with Radius Key Wrap
MSCHAPv2 for Change Password
MSCHAPv2 for User Authentication
EAP-MSCHAPv2
Overview of EAP-MSCHAPv2
EAP- MSCHAPv2 Flow in ACS
Windows Machine Authentication Against AD
Certificate Binary Comparison
Certificate Attributes
SAN
SAN-DNS
Rules Relating to Textual Attributes
Certificate Revocation
Machine Authentication
Microsoft AD, Managing External Identity Stores,
Authentication Protocol and Identity Store Compatibility
Identity Store
MSCHAPv1/MSCHAPv2
EAP-MSCHAPv2
EAP-TLS
OpenSSL License
License Issues
OpenSSL/Open SSL Project
Original SSLeay License
Appendix C Open Source License Acknowledgments
OL-24201-01
GL-1
O S S a R Y
GL-2
Capability of ACS to record user sessions in a log file
GL-3
Validity and conformance of the original information
GL-4
GL-5
GL-6
GL-7
GL-8
FTP
GL-9
GL-10
EAP-FAST PAC
GL-11
GL-12
GL-13
Service providerISP
GL-14
GL-15
Extension within certificate information
GL-16
GL-17
GL-18
GL-19
GL-20
IN-1
Symbols
IN-2
IN-3
Date expressions
IN-4
Formatting symbols
IN-5
Hide Detail command
IN-6
IN-7
Or operator 13-60,13-74
IN-8
Summary values
IN-9
Upper function
IN-10