T3559-90809
Page
Contents
Configuration
Other user management features
Account Synchronization
Account Manager AM
PST Importer
External access
Reporting
14 Configuring Outlook 113
Backup system administration
Audit Log
140
Index 145
Figures
Administrator Guide
Tables
Administrator Guide
Page
Related documentation
About this guide
Intended audience
HP technical support
Document conventions and symbols
Document conventions
TIP
Providing feedback
Subscription service
Other web sites
About this guide
Application Tasks
Riss overview
RIM applications for users
Power off
Riss power on/off
Power on
How to restart Riss after a power failure
Opt/bin/restart
Riss overview
User interface components
Accessing PCC
Introduction to Platform Control Center PCC
PCC user interface
User interface orientation tips
Views accessible from left menu
Views for common system administration tasks
Views for common tasks
Updating views before printing
Mining Overview on
Monitoring and reporting
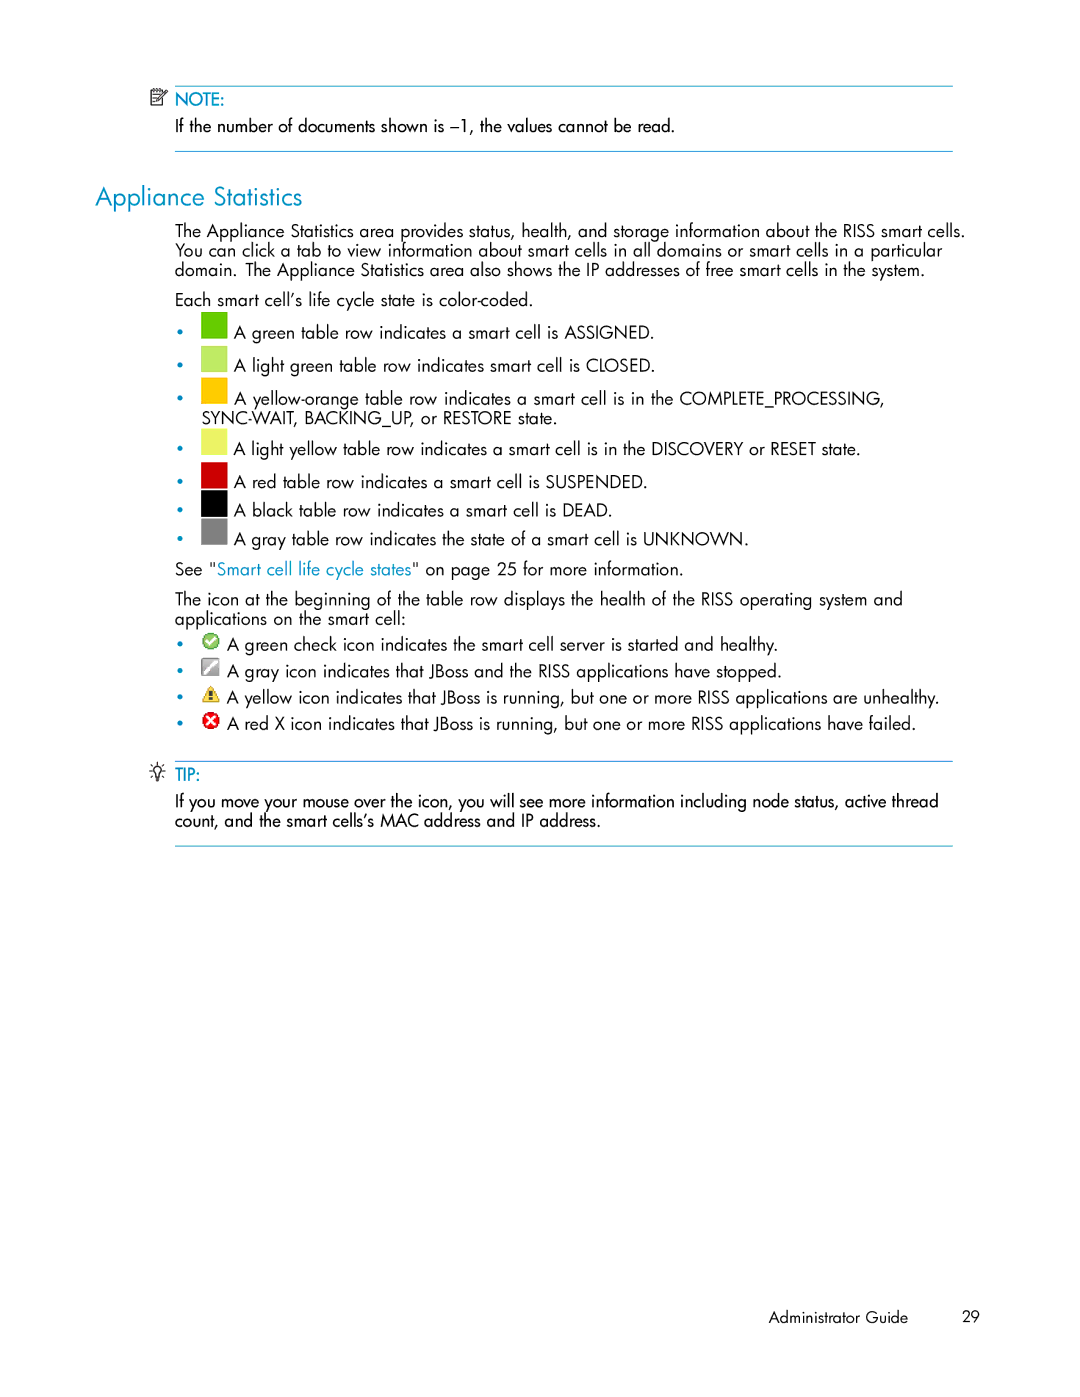
Smart cell life cycle states
Statuses and states
Smart cell life cycle states
Life cycle state Definition Importance
Discovery
If the cell’s status is OK, only the mirror cell has Failed
Overview
System Status
Application Events
Link to Overview
Application Events features
Account Manager Service
Application Events features
Appliance Performance
Appliance Statistics
Appliance Statistics features
Appliance Statistics features
Storage Status
Riss Version
System Status
Storage Status view features
Not represented in the bar graph
Link to Storage Status view
Actual percentage of CPU use
System Status view features
Starting, stopping, and restarting servers on the system
Appliance Control view features
Appliance Control
Performance Graph
Performance Graph features
Example Appliance Store graph
Link to Performance Graph view
Creating performance graphs
Example System Monitoring graph
System Status
Riss Configuration
Configuration
Domain Configuration
Appliance Configuration
Link to Firewall Settings view
Firewall Settings
SSL Configuration
Firewall ports
Deleting a certificate signing request
Available certificate signing requests
Creating a certificate signing request
Installing and generating a certificate on the Http portals
Installing and generating a certificate on the PCC portal
Software Version
Software Version view features
Displaying Software Version
Opt/bin/restarthttp
42 Configuration
Account Synchronization overview
Account Synchronization
Creating and running DAS jobs
Creating Ldap server connections
New Ldap connection
Creating jobs
Mapping information
Mapping advanced options
Assign a job to a portal
Assigning Http portals
Managing available Http portals
Editing or deleting jobs
Editing or deleting available Ldap connections
Starting, scheduling, and stopping DAS jobs
Viewing DAS history logs
Link to Account Manager view
Account Manager AM
Account Manager overview
Account Manager view
Account Manager view features
Account Manager view features
Managing user accounts
Adding a new user
Editing user account information
Editing user information
User account information
User account information
Adding repositories
Managing groups
Managing repositories
Edit the relevant entries Click the Save Now! button
Editing repository information
Repository information
Repository information
Manual Account Loader
Other user management features
Exporting user account information
Loading user account information
Error Recovery features
Error Recovery
Links to Error Recovery view
Error Recovery features
Repairing synchronization errors
Other user management features
Replication
Data management
Database Replication
This chapter discusses the following topics
DB2 on replica /opt/bin/repl/dbRepl status -brief -force
Database Replication features
Re-Initializing db2 replication
Replication Status
Replication Service General Status
Data Replication Flow
Data Replication Flow
Link to Cloning view
Smart cell cloning
Cloning smart cells copying data
Cloning view features
Cloning view features
Rescheduling all reprocessing schedules
Reprocessing
Editing reprocessing schedules
Link to Reprocessing view
Changing the reprocessing status
Using the Reprocessing Utility
Viewing reprocessing history logs
Repository-level retention
Searching for and editing a repository retention period
Link to Retention view
User Repository search results
Editing domain retention periods
Viewing retention history logs
Database and data backup
Changing the retention processing status
Restoring DB2 and master configuration file backups
Backup file locations
DB Backup History
Link to DB and Data Backup view
Opt/bin/backup/db2BackupUtility -restoredb2
This will delete the content of the VolBack directory
Usr/local/tsmBackup/rotateMasterConfigBackup -restore
Restoring the master configuration files
Reporting
Event Viewer features
Event Viewer
Searching the Event Viewer
Setting the Snmp server
Other Event Viewer features
Snmp Management
Downloading the Riss MIB
Selecting Snmp traps
Email Reporter
Setting Snmp Community
Receiving Snmp events by email
Detailed email reports
Detailed Email Reports
Logfile Sender
Creating and scheduling email reports
Links to LogFile Sender view
RIM Management
External access
Mining Overview
Link to RIM Management view
Mining Overview view features
System Services
System Services features
Configured Tasks
Journal Mining
Configured Tasks features
Journal Mining features
Selective Archiving
Synchronize Deleted Items
Tombstone Maintenance
External access
PST Importer overview
PST Importer
PST Importer process
Archive Request file
Installation procedure
Installing PST Importer
Installation requirements
Archive Request Loader
Using PST Importer
Creating or revising an Archive Request file
Click New Following window appears
PSTLaunchMgr MaxProcesses=1
Creating a new file
HPPSTInit Verbosity=3
Using PST Import Monitor
Validating file from command line
PST Import Monitor
Parameter Description
PST Import Monitor
PSTImporter MonitorPath=UNCPath
Displaying reports and log files
Collecting statistics impacts performance
PSTImporter Verbosity=X
Settings description
Archive Request file specifications
Tag Description
Tags in Header
Tags in FileSpec
Sample file
PST Importer
Granting user access to the Audit Log repository
Enabling the Audit Log feature
AuditLogEnabled=true DomainLogIP=VIP for this domain
Audit Log
Monitoring status
Setting Audit Log repository retention periods
Riss backup strategy
Backup system administration
Gaining access to the Riss backup server
Tivoli Storage Manager
TSM backup terms
Smart cell data backups
Separate Group Volumes
Policy domain structure
How Riss configures TSM
Adding and labeling new media Web interface
Library properties
Server process list
Adding and labeling new media command line
Restoring a smart cell
Provisioner status
TSM Disaster Recovery Manager
Preparing the backup server for disaster recovery
Example Preparing the backup server for a disaster
Things to back up
Tsm INTERNALbackup db type=full devclass=DC.TAPE
Tsm INTERNALset drmcouriername Joe’s courier service
Tsm INTERNALset drmvaultname Ironvault, somewhere
Example 1. tsm INTERNALquery drmstatus
Example Recovering the server from a disaster
Recovering the backup server
INTERNALaudit library LIB.TAPE command
RECPLAN.RECOVERY.SCRIPT.DISASTER.RECOVERY.MODE.CMD
Administrator Guide 111
Backup system administration
Configuring your system for Exchange and Outlook
14 Configuring Outlook
Configuring user accounts on servers
Scheduler,
User accounts on customer servers
Installing the Outlook plug-in
Registry settings
For HKLM\Software\Hewlett-Packard\Outlook PlugIn\Cache
For HKLM\Software\Hewlett-Packard\Outlook PlugIn\Search
For HKLM\Software\Hewlett-Packard\Outlook PlugIn\PlugInURLs
RetrievalHost=HOSTNAME Deprecated and is no longer used
For HKLM\Software\Hewlett-Packard\Outlook PlugIn
Installing and configuring the Outlook plug-in for users
Manually creating other registry settings
Enabling journaling on mailbox stores
Setting registry key for journaling
Configuring journal mining
Publishing forms
Configuring mailbox mining
Configuring Exchange for email stub support
Adding mailboxes using Mail Attender
Setting up Information Stores
Settings view button
Scheduler
Set up Auto-Search
Starting Scheduler
Be selected by Mail Attender
DocRef Host Httphost
Scheduling an event
Enabling load balancing message by message
Domain.jcml
Enabling a scheduled event
Editing selective archiving events
Administrator Guide 125
Selective Archiving Event window
Editing journal mining events
Journal Mining Event window
Editing Synchronize Deleted Items events
Editing tombstone maintenance events
Synchronize Deleted Items event window
Copying a scheduled event
Deleting a scheduled event
Modifying rules in Mail Attender
Enter a description
Modifying a rule using Mail Attender
Add Information Stores window
Monitoring View
Starting selective archiving
Status View
Monitoring View window
Location of deleted items
Deleting end-user deleted items on the Riss
Configuring deletion retention
PTDelItems TagUndeletedItems=False
Mailbox store
Scheduling deletion from Riss
Deletion settings
Append to a CSV file
Creating a Mail Attender rule
End-user delete security
SetAdmin.exe
CSV Columns
Summary report
Multiple mail stores
System requirements
Session
Multiple Riss systems
Temporary storage in Drafts folder
Mbarney=http//mbarney Papoon=http//papoon
Asp.config file has several OWA configuration settings
Configuring the asp.config file
Multi-user support
Changing the ASP time-out
Browser functionality
144 Configuring Outlook
Index
Account Error Recovery view Account Manager
Account Manager Service, 28 account synchronization
Outlook plug-in,114 PST Importer
Events
PCC
Repairing, 58 system requirements

 TIP:
TIP: