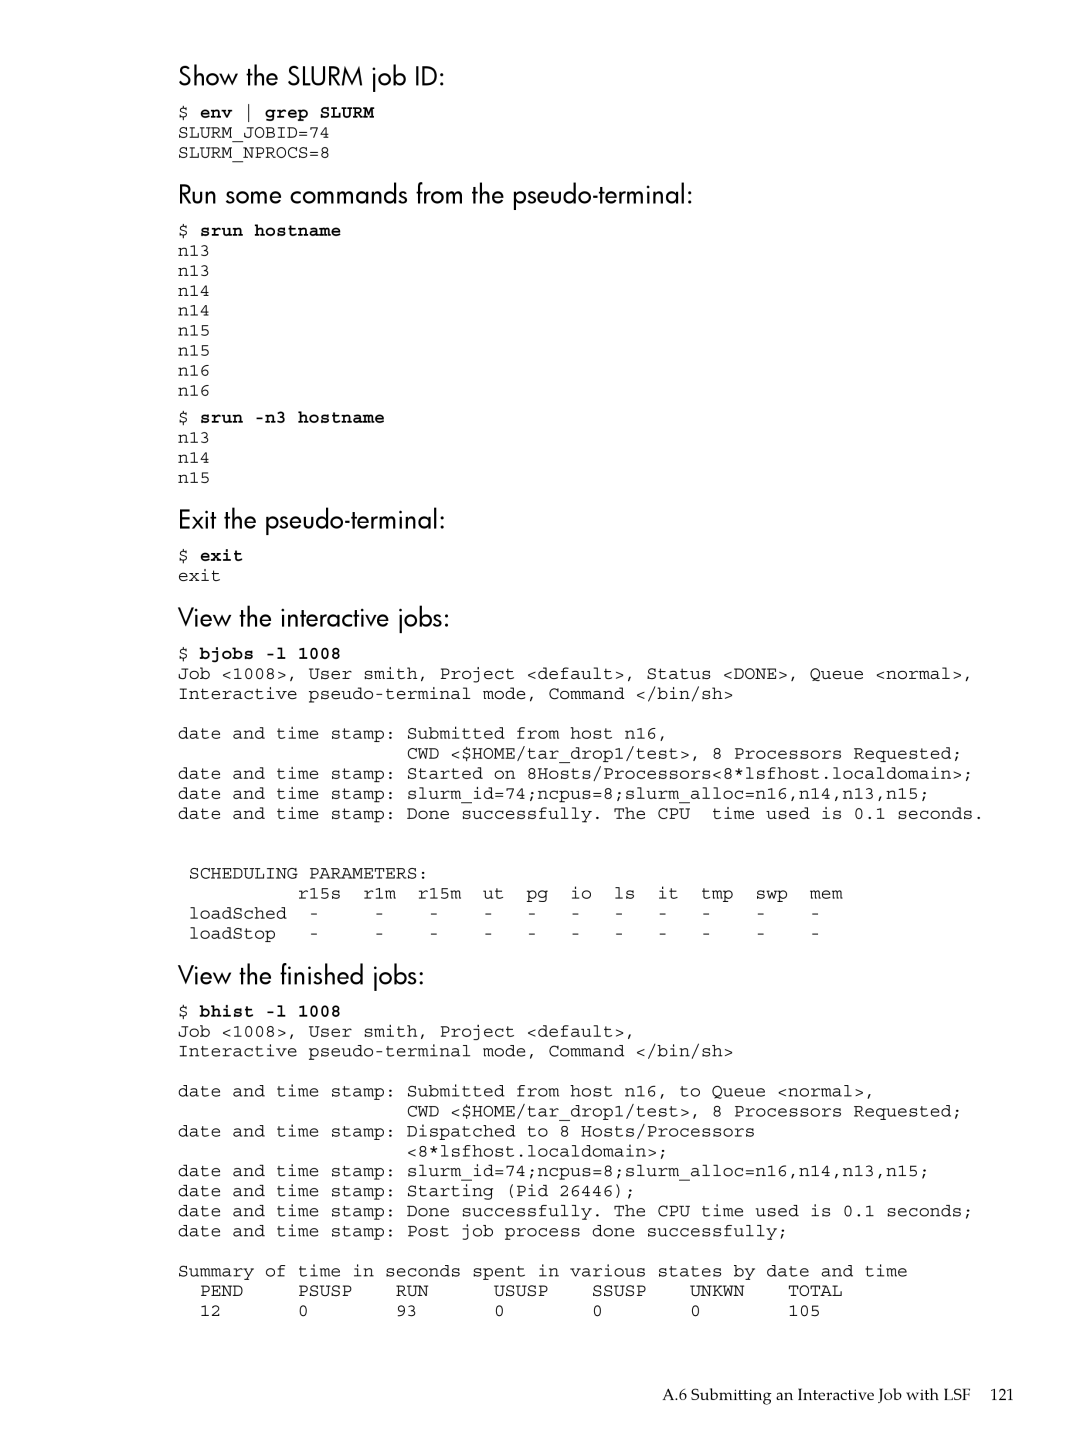
Show the SLURM job ID:
$ env grep SLURM SLURM_JOBID=74 SLURM_NPROCS=8
Run some commands from the pseudo-terminal:
$ srun hostname n13
n13
n14
n14
n15
n15
n16
n16
$ srun
n14
n15
Exit the pseudo-terminal:
$ exit exit
View the interactive jobs:
$ bjobs -l 1008
Job <1008>, User smith, Project <default>, Status <DONE>, Queue <normal>, Interactive
date and time stamp: Submitted from host n16,
CWD <$HOME/tar_drop1/test>, 8 Processors Requested; date and time stamp: Started on 8Hosts/Processors<8*lsfhost.localdomain>; date and time stamp: slurm_id=74;ncpus=8;slurm_alloc=n16,n14,n13,n15; date and time stamp: Done successfully. The CPU time used is 0.1 seconds.
SCHEDULING | PARAMETERS: |
|
|
|
|
|
|
|
| ||
| r15s | r1m | r15m | ut | pg | io | ls | it | tmp | swp | mem |
loadSched | - | - | - | - | - | - | - | - | - | - | - |
loadStop | - | - | - | - | - | - | - | - | - | - | - |
View the finished jobs:
$ bhist -l 1008
Job <1008>, User smith, Project <default>,
Interactive
date and time stamp: Submitted from host n16, to Queue <normal>,
CWD <$HOME/tar_drop1/test>, 8 Processors Requested;
date and time stamp: Dispatched to 8 Hosts/Processors <8*lsfhost.localdomain>;
date and time stamp: slurm_id=74;ncpus=8;slurm_alloc=n16,n14,n13,n15;
date and time stamp: Starting (Pid 26446);
date and time stamp: Done successfully. The CPU time used is 0.1 seconds;
date and time stamp: Post job process done successfully;
Summary of time in seconds spent in various states by date and time
PEND | PSUSP | RUN | USUSP | SSUSP | UNKWN | TOTAL |
12 | 0 | 93 | 0 | 0 | 0 | 105 |
A.6 Submitting an Interactive Job with LSF 121
