C H A P T E R 4 Using the Web Device Manager
Monitoring Switch Activity
With the Web Device Manager you can view traffic, utilization, and error statistics for the switch and for individual ports. For more information on statistics, see “Port Traffic Statistics,” “Port Error Statistics,” and “Packet Analysis” in Chapter 5.
To view port statistics
1Click the Monitor menu, and then click Port Statistics.
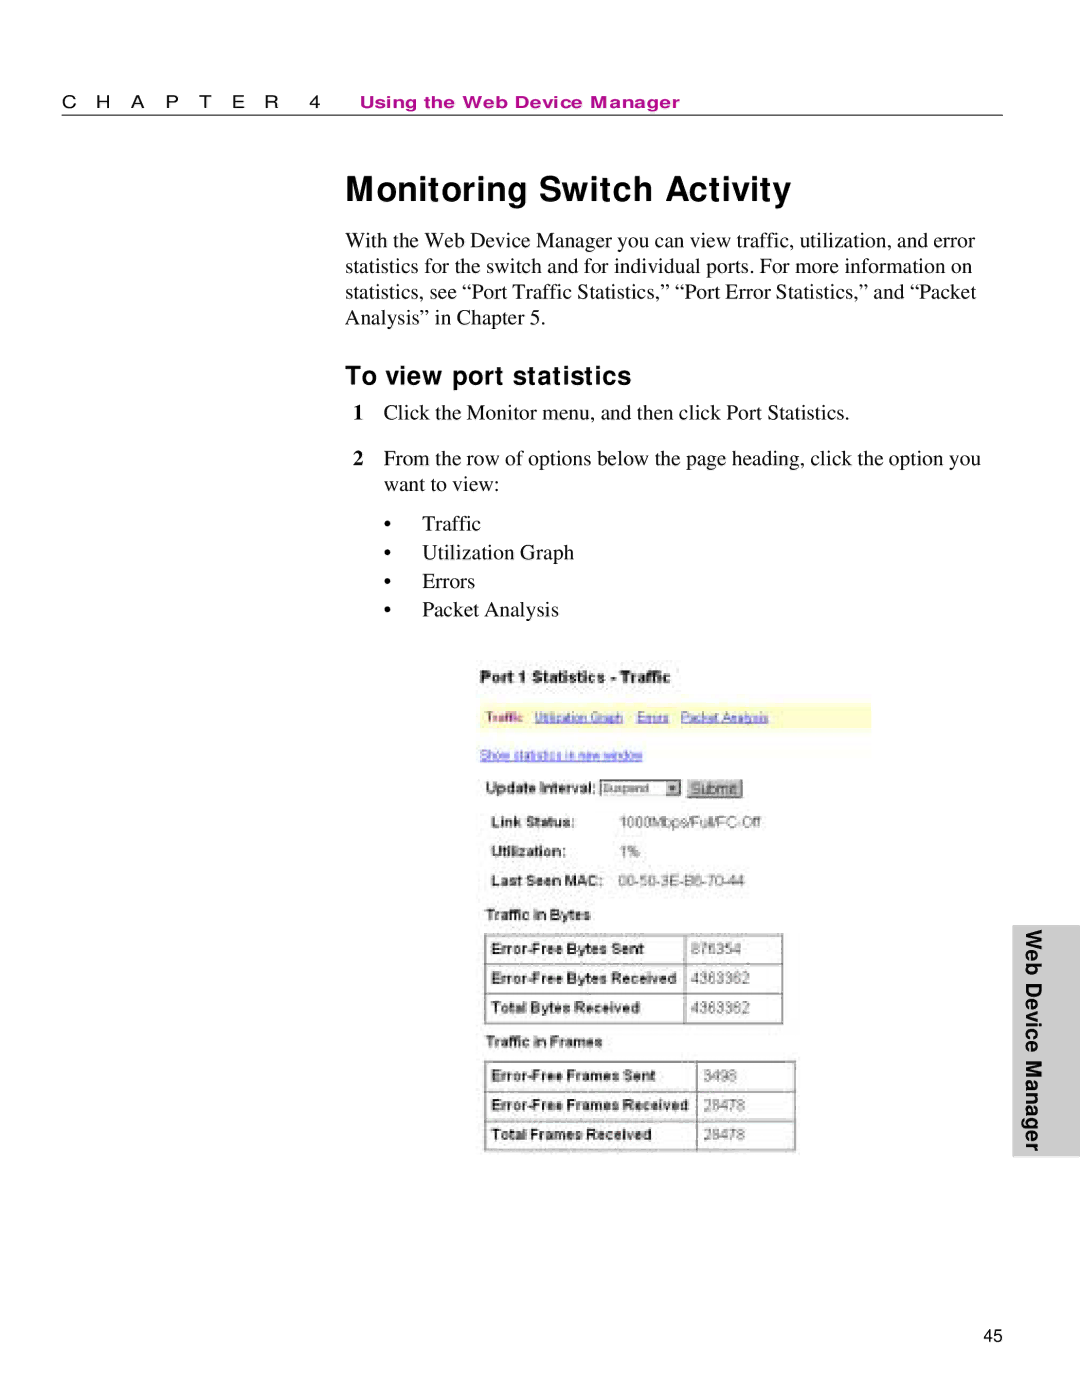
2From the row of options below the page heading, click the option you want to view:
•Traffic
•Utilization Graph
•Errors
•Packet Analysis
Web Device Manager
45
