Statistics
8.6. The "IO Graphs" window
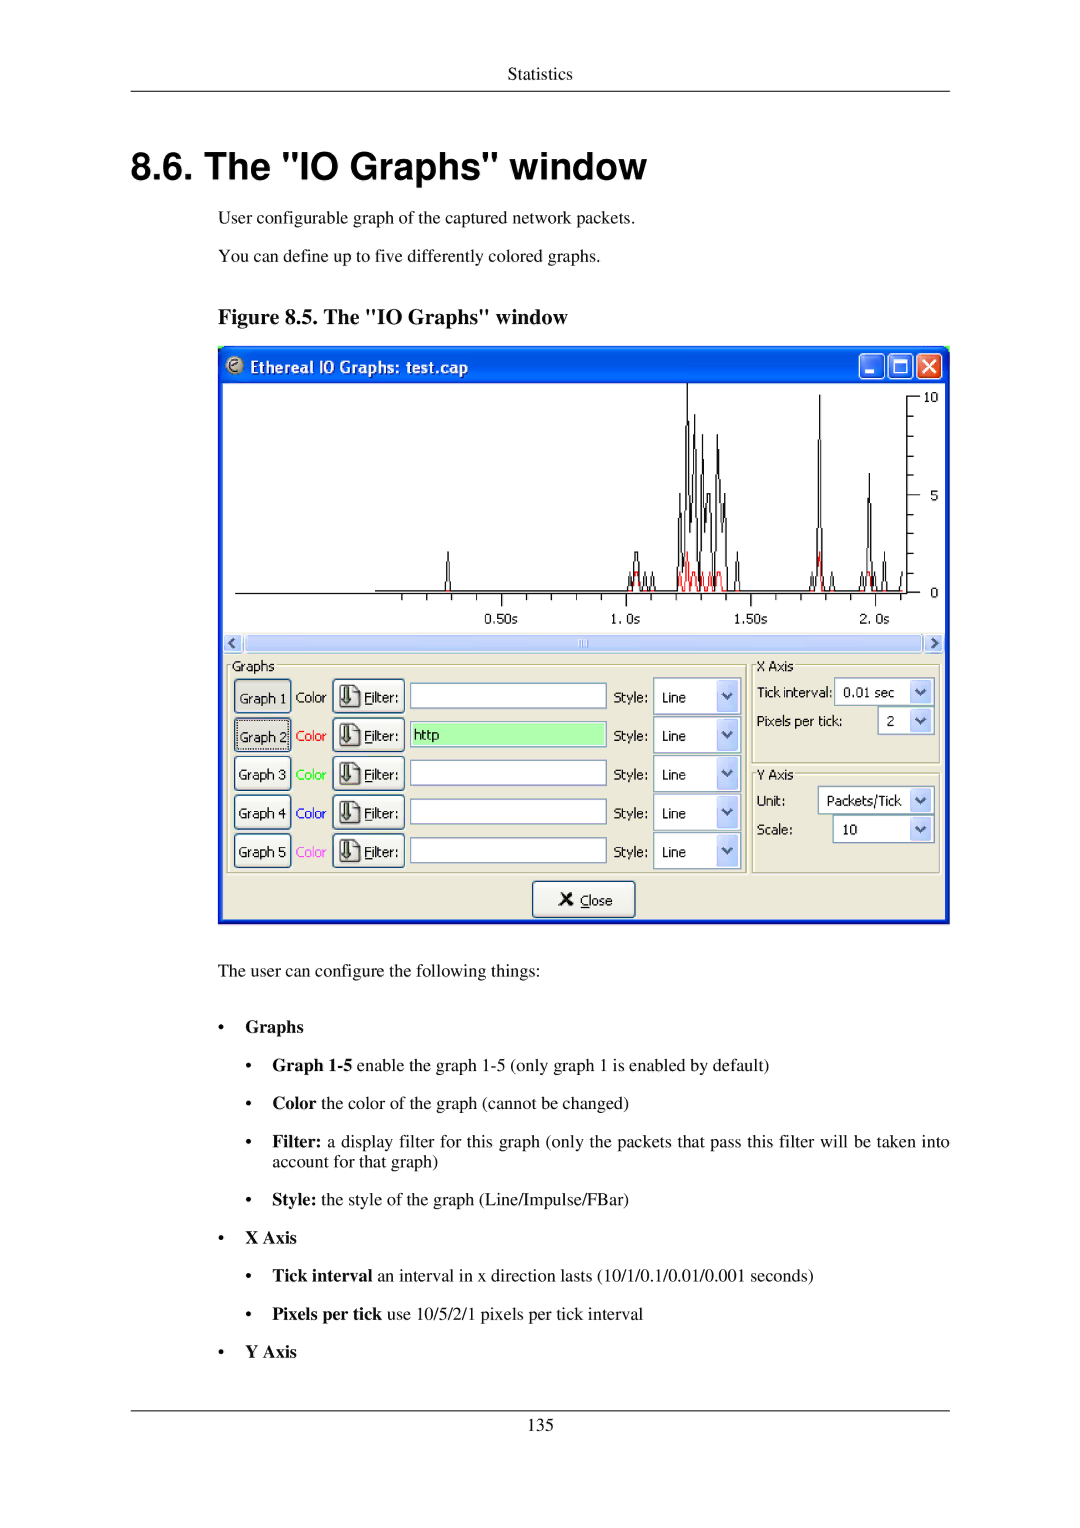
User configurable graph of the captured network packets.
You can define up to five differently colored graphs.
Figure 8.5. The "IO Graphs" window
The user can configure the following things:
•Graphs
•Graph
•Color the color of the graph (cannot be changed)
•Filter: a display filter for this graph (only the packets that pass this filter will be taken into account for that graph)
•Style: the style of the graph (Line/Impulse/FBar)
•X Axis
•Tick interval an interval in x direction lasts (10/1/0.1/0.01/0.001 seconds)
•Pixels per tick use 10/5/2/1 pixels per tick interval
•Y Axis
135
