Sun Fire 280R Server Owner’s Guide
Please Recycle
FCC Class B Notice
FCC Class a Notice
ICES-003 Class B Notice Avis NMB-003, Classe B
ICES-003 Class a Notice Avis NMB-003, Classe a
Bsmi Class a Notice
Vi Sun Fire 280R Server Owner’s Guide January
Declaration of Conformity
Viii Sun Fire 280R Server Owner’s Guide January
Safety Precautions
Safety Agency Compliance Statements
Selv Compliance
Laser Compliance Notice
Einhaltung sicherheitsbehördlicher Vorschriften
Einhaltung der SELV-Richtlinien
Gehäuseabdeckung
Conformité aux normes de sécurité
Positionnement d’un produit Sun Conformité Selv
Bloc-batterie Couvercle
Normativas de seguridad
Cumplimiento de la normativa Selv
Batería de litio
Norge Sverige
GOST-R Certification Mark Nordic Lithium Battery Cautions
Contents
Hardware and Software Configuration
System Administration
Using and Servicing Internal Storage Devices
System Specifications
Diagnostics, Monitoring, and Troubleshooting
Connector Signal Descriptions
Preface
How This Book Is Organized
Typographic and Command Entry Conventions
Using Unix Commands
Related Documentation
Shell Prompts
Ordering Sun Documentation
Accessing Sun Documentation Online
Sun Welcomes Your Comments
About the Sun Fire 280R Server Hardware
System Overview
Sun Fire 280R Server Owner’s Guide January
System Overview
Sun Fire 280R Server Owner’s Guide January
Front Panel Features
About Front and Back Panel Features
Filler panel
Back Panel Features
Status and Control Panel Features
Keyswitch Settings
System LED Indicators
About the Sun Fire 280R Server Software
Sun Fire 280R Server Owner’s Guide January
System Setup
About the Parts Shipped to You
Using the Setup and Rackmounting Guide
Tools Required for Setup and Rackmounting
Before You Begin
How to Install the Sun Fire 280R Server
What to Do
System Setup
Tab Sun Fire 280R Server Owner’s Guide January
Configure the network interface
Set up a console for installing your server
Turn on power to your server
Install and boot the operating system software
Load the Sun Fire 280R server hardware online documentation
Load additional software from the server media kit
Rackmounting Guidelines
About System Rackmounting
Sun Fire 280R Server Owner’s Guide January
How to Install the System Into the Rack
Dimple Ball-bearing runner
Innermost glide
Flat spring catch
Tigh fron
Secure the server to the rails
Connect the external cables to the back panel of the system
What Next
How to Remove the System From the Rack
Locate the flat spring catch shown in the following figure
Prepare to remove the system
About Communicating With the System
How to Attach an Alphanumeric Ascii Terminal
What Next
How to Configure a Local Graphics Console
What to Do
Sun Fire 280R Server Owner’s Guide January
What Next
How to Power On the System
Press the front panel Power button once
Turn the front panel keyswitch to the Power-On/Off position
Turn the keyswitch to the Locked position
How to Power On the System With Full Diagnostics Enabled
Turn the front panel keyswitch to the Diagnostics position
Turn the keyswitch to the Locked position
Solaris 8 Installation Requirement
How to Install the System Software
System Setup
How to Select the Boot Device
At the ok prompt, type
Ok reset-all
Assign a host name to the system
How to Configure the Standard Ethernet Interface
Resume the installation of the system
What Next
Before You Begin
Assign a network host name to the interface
How to Add an Ethernet Interface
Zardoz # cat /etc/hostname.eri0
Zardoz # cat /etc/hosts
How to Connect a Twisted-Pair Ethernet TPE Cable
RSC TPE connector System TPE connector
How to Boot the System Using the Standard Ethernet Interface
Ok boot net install
Wait for the system halt messages and the ok prompt
How to Power Off the System
Off position
System Administration
Error Correction and Parity Checking
Hot-Pluggable Disk Drives
Easily Accessible Status LEDs
System Environmental Monitoring and Control
Support for RAID Disk Configurations
Temperature Controls
System Fans
Power Supplies
Hot-Swappable Power Supplies
Power Supply Redundancy
Automatic System Recovery
Improved System Diagnostics Software
Enhanced System Availability Software
Managing and Monitoring System Performance
About Managing the System
Isolating Failed Components
Diagnosing Intermittent Problems
Problem Analysis
Using the Sun Remote System Control RSC Card
Local Server
About Storage Management Tools
System Administration
About Personal Computer Connectivity
Hardware and Software Configuration
About System Memory
Configuration Rules
System Memory Interleaving
Group Bank No interleaving Way interleaving
About Central Processing Unit CPU Modules
About Peripheral Component Interconnect PCI Buses
PCI
About Network Interface Options
About Disk Array Configurations and Concepts
Disk Mirroring RAID
Disk Concatenation
Hot Spares
Disk Striping RAID
Disk Striping With Parity RAID
For More Information
Hot Plug
About Internal Disk Drives
Internal disk drive LEDs
Hot-Plug Device Information
Hot-Plug Configuration Rules
Hot-Plug Procedure Information
About Power Supplies
Sun Fire 280R Server Owner’s Guide January
About the Serial Ports
Target Devices
Configuration Bus Lengths
About the Small Computer System Interface Scsi Port
External Scsi Cabling and Termination
Multi-initiator Support
About the Parallel Port
About the Universal Serial Bus USB Ports
About the Standard Ethernet Port
About the Fibre Channel-Arbitrated Loop FC-AL and Port
Configuration
Initial Support
About the Remote System Control RSC Card and Ports
RSC Features and Ports
RSC Monitoring
RSC Jumpers
Plug the standard TPE cable into the RJ-45 connector
How to Use the RSC Ports
Plug the RJ-11 telephone jack into the RJ-11 connector
About the Remote System Control RSC Software
Enter the following commands at the ok prompt
How to Redirect the Host Console to RSC
About the Main Logic Board Jumpers
To implement the new mode, at the ok prompt, type
About Changing Serial Port Settings
How to Configure Serial Settings
J2103
About Flash Permanent Read Only Memory Prom Jumpers
About Multipathing Software
Sun Fire 280R Server Owner’s Guide January
About Sun Clustering Software
Sun Fire 280R Server Owner’s Guide January
Using and Servicing Internal Storage Devices
How to Avoid Electrostatic Discharge
Use an antistatic wrist strap
Use an antistatic mat or similar surface
How to Remove a Disk Drive
Disk drive handle
Repeat the procedure for the other drive if necessary
Release the drive handle on the disk drive
How to Install a Disk Drive
Align the disk drive to its drive bay
Close and then lock the system front doors
How to Remove a Disk Drive Using the Hot-Plug Operation
Type c at the prompt to verify the list of devices
Type the following luxadm command
Become superuser or the root user
List the system’s current c1t1d* device links again
Physically remove the disk drive and press the Return key
What Next
How to Install a Disk Drive Using the Hot-Plug Operation
Insert the drive into its disk drive bay
List the system’s current c1t1d* logical device links again
Format the disk by typing the following command
Type the number of the hot-plug drive you are formatting
Repeat through for every drive you are hot-plugging
What Next
How to Initiate a Reconfiguration Boot
When the ok prompt is displayed, type the following command
About the Digital Video Disc DVD Drive
How to Insert a Digital Video Disc DVD Into the Drive
Gently push the tray back into the drive
What Next
Kill processes accessing the DVD drive, if necessary
How to Eject a Digital Video Disc DVD With Software Commands
From the console device, type
How to Eject a Digital Video Disc DVD Manually
Press the Eject button on the front panel
Unfold and straighten one end of a large wire paper clip
How to Eject a Digital Video Disc DVD in an Emergency
Turn off the power to your system
What Next
Clean the disc with compressed air
How to Clean a Digital Video Disc DVD
Data area of disc Incorrect
Thermal Conditioning
About the Tape Drive and Tape Cartridges
Handling and Storing Tape Cartridges
How to Insert a Tape Cartridge
What Next
Before You Begin What to Do
How to Remove a Tape Cartridge
Check that there is no drive activity
Push the Eject button and remove the tape cartridge
What Next
How to Clean the Tape Drive
How to Control the Tape Drive
Insert a cleaning cartridge into the drive
Sun Fire 280R Server Owner’s Guide January
Diagnostics, Monitoring, Troubleshooting
Sun Fire 280R Server Owner’s Guide January
Diagnostics, Monitoring, and Troubleshooting
Local Diagnostic Tool Use
About Diagnostic Tools
Firmware OS Software
About Monitoring the System
Item Monitored What RSC Reveals
Remote Host Connection
About Isolating Failed Components
About Isolating Failures Using Sun Remote System Control RSC
About Isolating Failures Using OpenBoot Diagnostics
About Isolating Failures Using Power-On Self-Test Post
Bist
About Diagnostic Levels
Test Command
About OpenBoot Diagnostics Tests
Following table describes what each self-test does
Test-allCommand
About OpenBoot Prom Commands
Error Messages
Watch-clock Command
About Exercising the System
About Exercising the System Using SunVTS Software
Sun Fire 280R Server Owner’s Guide January
Before You Begin
How to Monitor the System
How to Use Sun Remote System Control RSC Software
Diagnostics, Monitoring, and Troubleshooting
What to Do
How to Isolate Failed Components
How to Use Default Nvram Parameters
Run each OpenBoot Diagnostics test from the ok prompt
How to Isolate Failures Using Sun Remote System Control RSC
How to Isolate Failures Using Power-On Self-Test Post
Ok setenv diag-switch? true
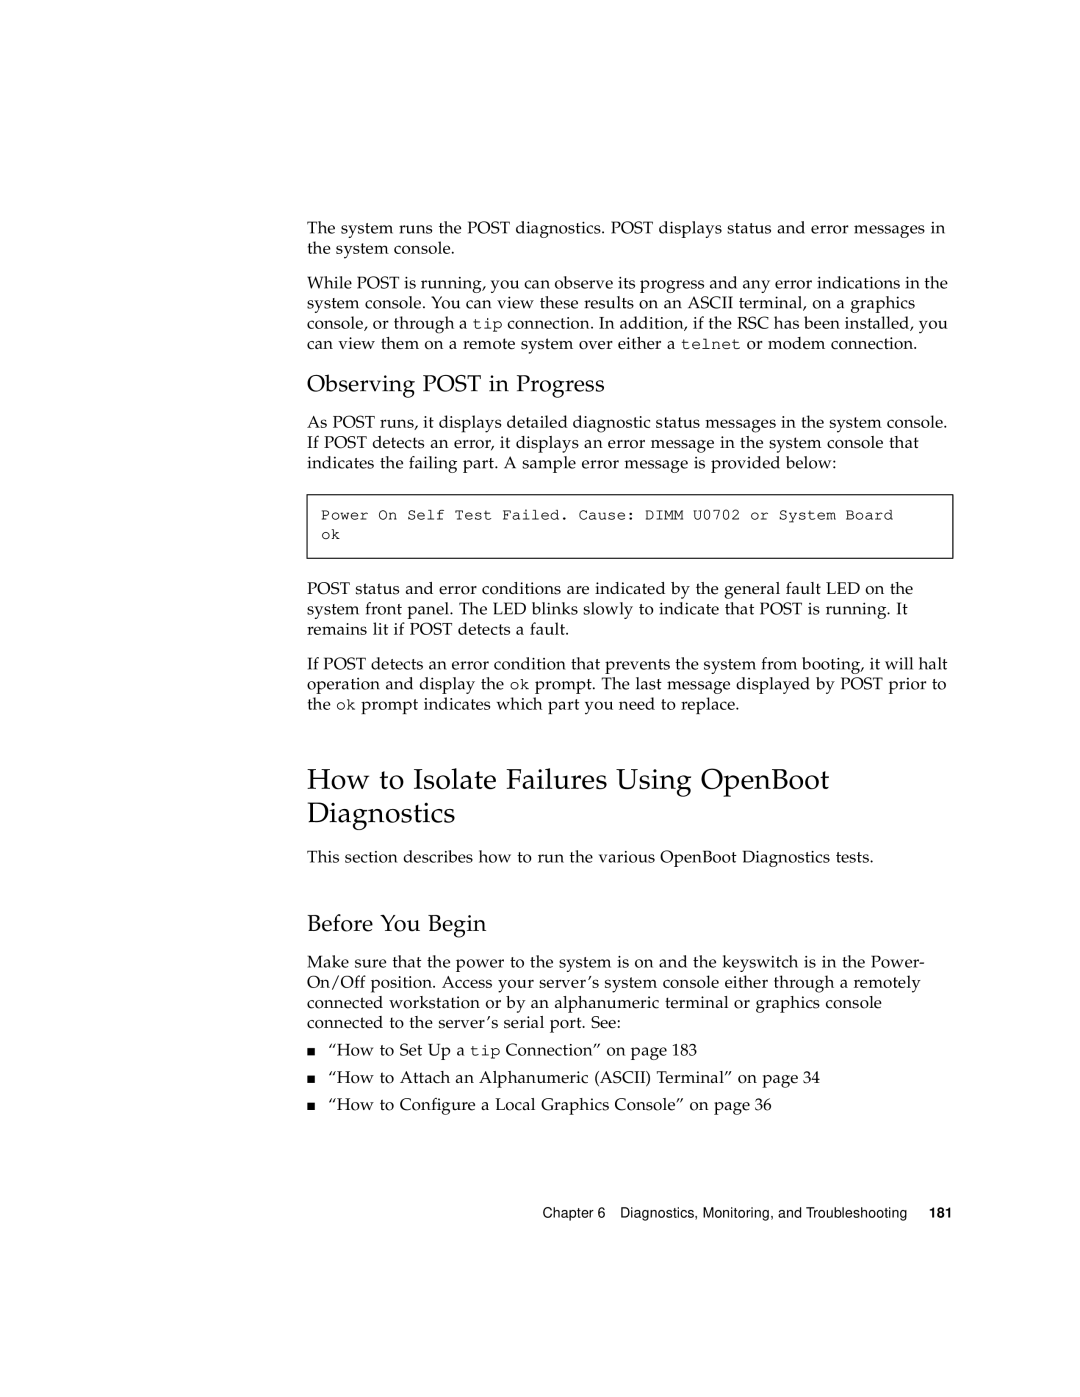
Observing Post in Progress
How to Isolate Failures Using OpenBoot Diagnostics
Set the diag-level configuration variable
Reset the system by typing the reset-allcommand
At the obdiag prompt, type the command you want to run
What Next
How to Set Up a tip Connection
How to Use a Second Sun Server to Diagnose Problems
A Shell Tool window on the Sun server, type
How to Verify the Baud Rate
Common Problems With tip Connections
How to Set the Diagnostics Level
How to Configure a Local Graphics Console
Set the desired diagnostics level, type
How to Diagnose Specific Problems
Reset the system, type
Network Communications Failure
Use the test command to test the network device, type
Become superuser Type
Power-On Failure
Reboot the system to make the changes effective
Video Output Failure
Run Post diagnostics
Verify that the CPU modules and memory are seated correctly
Observe Post results
At the system ok prompt, type
FC-AL Disk Drive Failure
Replace the drive indicated by the failure message
FC-AL Controller Failure
Use the test command to get more information, type
DVD/CD-ROM or Scsi Drive Failure
Run the test command, type
Use the test command to gather more information, type
Scsi Controller Failure
Power Supply Failure
Gather more information by using the test command, type
Dimm Failure
Diagnostics, Monitoring, and Troubleshooting
Type the following
How to Exercise the System
How to Check Whether SunVTS Software Is Installed
How to Exercise the System Using SunVTS Software
# cd /opt/SUNWvts/bin # ./sunvts -display localhostname0
What Next
Sun Fire 280R Server Owner’s Guide January
Connector Signal Descriptions
Serial Port Signals
Reference for the Serial Port a and B Connectors
Serial Port a and B Connector Diagram
Appendix a Connector Signal Descriptions
TPE Connector Diagram TPE Connector Signals
Reference for the Twisted-Pair Ethernet TPE Connector
External UTP-5 Cable Lengths
TPE Cable-Type Connectivity
UltraSCSI Connector Diagram UltraSCSI Connector Signals
Reference for the UltraSCSI Connector
Termpower
SCSIBDAT4
SCSIBDAT9
Parallel Port Signals
Reference for the Parallel Port Connector
Parallel Port Connector Diagram
Gnd Ground
FC-AL Port Connector Diagram FC-AL Connector Pin Assignments
USB Connector Pin Assignments
Reference for the Universal Serial Bus USB Connectors
USB Port Connector Diagram
Sun Fire 280R Server Owner’s Guide January
System Specifications
Reference for Physical Specifications
Reference for Electrical Specifications
Reference for Environmental Specifications
Index
Index 222 Sun Fire 280R Server Owner’s Guide January
Etc/hostname file Etc/hosts file
Index 224 Sun Fire 280R Server Owner’s Guide January
Boot-device, 48 diag-switch?, 179 operating system software
Index 226 Sun Fire 280R Server Owner’s Guide January
Veritas
Index 228 Sun Fire 280R Server Owner’s Guide January