Reliable Transaction Router System Managers Manual
June
Contents
Transaction Management
RTR Monitoring
RTR Command Line Interface
100
103
104
105
Server Shadowing and Recovery
RTR Utility Error Messages RTR log messages Index Examples
Creating Monitor Pictures
XA Support
Tables
Arithmetic Operators in Display Commands
Page
Structure of Document
Purpose of this Manual
Intended Audience
Conventions
Related Documentation
Readers Comments
Conventions Used in this Guide
Convention Meaning
Page
Entering Commands
Getting Started
Introduction Entering Commands
Online Help
Command Procedures
Remote Commands
Introduction Online Help
Rtralrsta
Introduction Remote Commands
Setting Up-An Example
Introduction
Example 2-1 Local Configuration of each Node
Starting and Setting Up RTR Setting Up-An Example
FrontendsFERoutersTRBackendsBE
Creating a Recovery Journal
Example 2-2 Remote Setup from one Node
Starting and Setting Up RTR Creating a Recovery Journal
Changing a Facility
Starting and Setting Up RTR Changing a Facility
Example 2-3 Reconfiguration Using Delete and Create Facility
O N T E N D S U T E R S
Setting up Callout Servers
Example 2-4 Reconfiguration Using Extend Facility
Example 2-5 Configuration of Callout Servers
Starting and Setting Up RTR 2.5 Setting up Callout Servers
Router Load Balancing
RTR Privileges
Starting and Setting Up RTR Router Load Balancing
Setting RTR Privileges on Unix Systems
Starting and Setting Up RTR RTR Privileges
Setting RTR Privileges on OpenVMS Systems
Setting RTR Privileges on Windows NT Systems
RTR ACP Virtual Memory Sizing
Starting and Setting Up RTR RTR ACP Virtual Memory Sizing
Astlm Biolm Diolm Fillm Pgflquota
Unix Virtual Memory Sizing
Network Transports
Specifying the Link Transport Protocol
Using the Tunnel Prefix
Troubleshooting Tunnel and Wildcard Connections
TCP Services File
Anonymous Clients
Starting and Setting Up RTR Network Transports
Interoperation with RTR Version 2 Using DECnet
$ DEFINE/SYSTEM Rtrprefprot Rtrdnafirst
Running RTR as a Service on Windows NT
Network Protocol Selection on OpenVMS
Files Created by the RTR Windows NT Service
Active
How RTR Selects Processing-states Roles for Nodes
Role Assignment for Backend Node Partitions
Show Partition command on each backend node is as follows
Router Backend a Backend B
SET Partition test/PRIORITYLIST=bronze,gold
Router Selection
Router Site a Node-A1 Site B Node-B1 Node-A2 Node-B2
RTR Create Facility test/FRONTEND=Z/ROUTER=A,B,C
Overview
What is a Partition?
What is Partition Management?
Partition Naming
Life Cycle of a Partition
Persistence of Partition Definitions
Binding Server Channels to Named Partitions
Explicit Partition Creation
Entering Partition Commands
Partition Management Entering Partition Commands
Command Line Usage
Programmed Partition Management
Command Line Example
Managing Partitions
Controlling Shadowing
Programming Information
Controlling Recovery
Example usage of the qualifiers
Partition Management Managing Partitions
Controlling the Active Site
Controlling Failover
Char
Controlling Transaction Replay
Rtruns32t newLimit
Partition Management Displaying Partition Information
RTR$DEFAULTFACILITY
Displaying Partition Information
Transaction Management
Exception Transactions
Command Line Examples
Transaction Management Overview
Transaction Management Overview Transaction State Changes
19 Valid Transaction State Transitions
4Transaction Management
RTR Monitoring
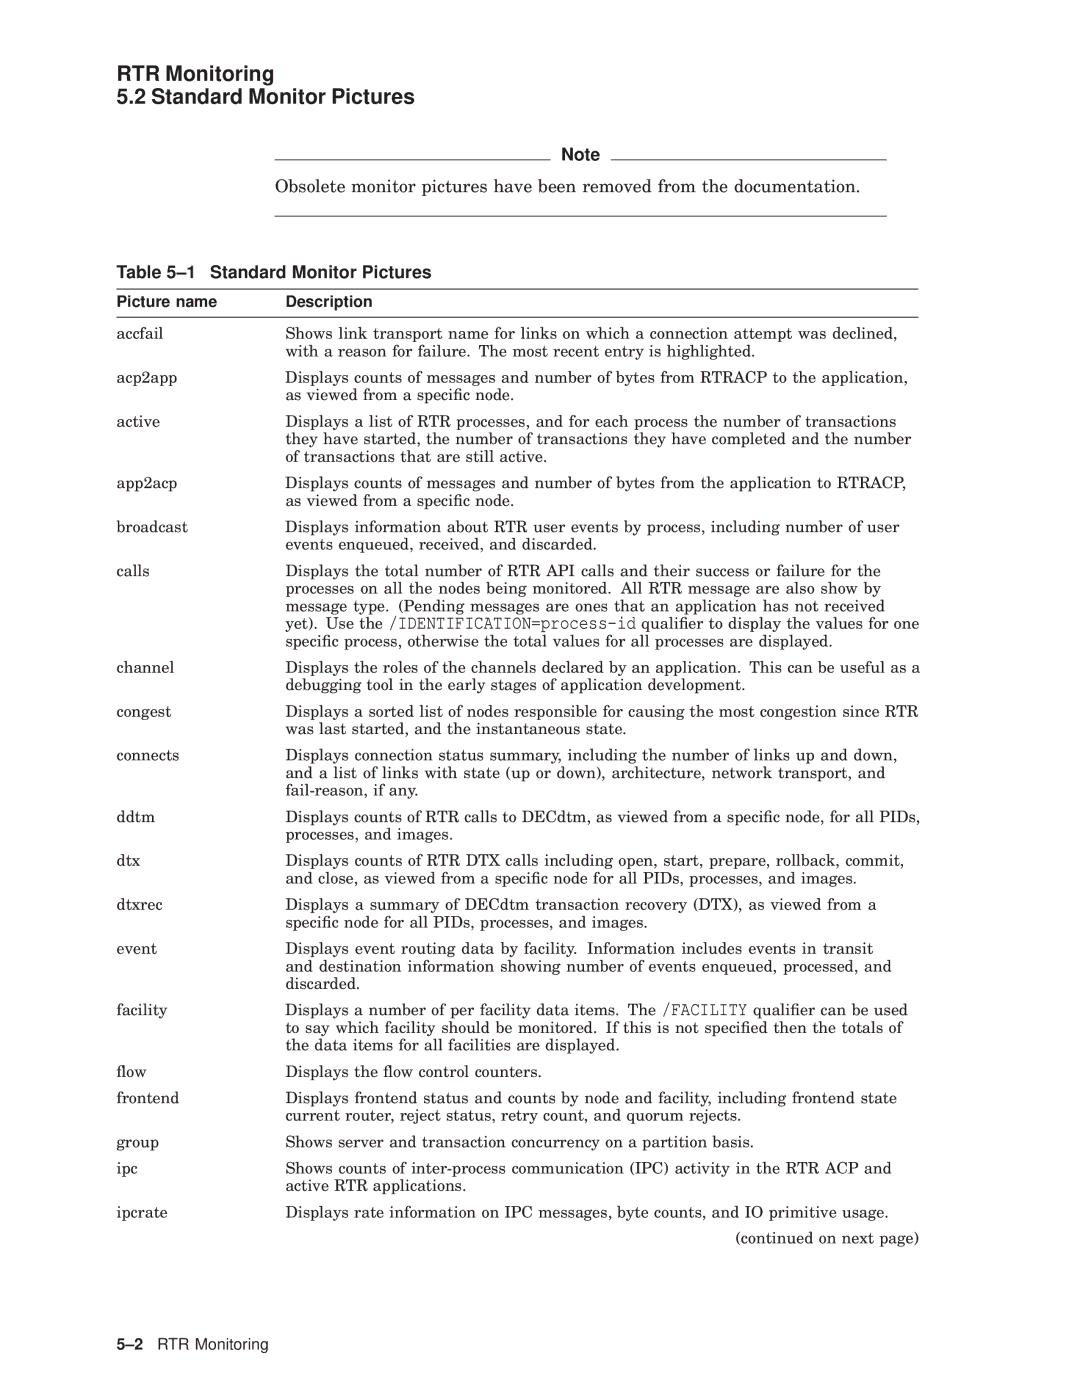
Standard Monitor Pictures
RTR Monitoring Standard Monitor Pictures
Standard Monitor Pictures
Cont Standard Monitor Pictures
Monitor Accfail Link Acceptance Failures
Dmark DEC.ZKO.DMARK
Monitor ACP2APP
RTR Monitoring Standard Monitor Pictures Monitor Active
Monitor APP2ACP
Monitor Broadcast
PID -ALL
RTR Monitoring Standard Monitor Pictures Monitor Calls
Monitor Channel
Monitor Connects
Calls
Monitor Event
Monitor Facility
Monitor Group Fields
RTR Monitoring Standard Monitor Pictures Monitor Flow
Monitor Group
Monitor Journal
RTR Monitoring Standard Monitor Pictures Monitor IPC
Monitor Ipcrate
Monitor Link
Monitor Netbytes
Monitor Partition States
RTR Monitoring Standard Monitor Pictures Monitor Netstat
Monitor Partit
Monitor Recovery
Nodea RTR$DEFAULTFACILITY
Monitor Queues
Monitor Quorum
Monitor Rejects Fields
Monitor Recovery States
Monitor Rejects
RTR Monitoring Standard Monitor Pictures Monitor Rejhist
Monitor Response
Process 38009A8B
Monitor Rejhist Fields
RTR Monitoring Standard Monitor Pictures Monitor Rolequorum
Monitor Routers
Monitor Routing
Quorum Counts by Facility 7-JAN-1999 143248, Node -ALL
RTR Monitoring Standard Monitor Pictures Monitor Rscbe
Monitor RTR
RTR Monitoring Standard Monitor Pictures Monitor Stalls
RTR Monitoring Standard Monitor Pictures Monitor System
Type Monitor Connects
RTR Monitoring Standard Monitor Pictures Monitor TPS
Monitor Traffic
Monitor Trans
Servers
Monitor XA
RTR Monitoring Standard Monitor Pictures Monitor V2CALLS
Monitor XA
Page
RTR Command Line Interface
RTR Command Reference
ADD Facility
Call Rtraccepttx
Format
Description
Call Rtraccepttx
CHANNELNAME=RTR$DEFAULTCHANNEL
Qualifiers
Forget Noforget
Independent Noindependent
Related Commands
Accept the current transaction with a reason
Call Rtrbroadcastevent
Parameters
Call Rtrbroadcastevent message-field1 ,message-field2
Message-field1 ,message-field2
EVENTNUMBER=user-event-number
Parameters for rtrbroadcastevent
CHANNELNAME=channel-name
Generated Format Strings
LENGTHOFFIELD=field-length
RECIPIENTSPEC=rcpspc
TYPEOFDATA=STRING Signed Unsigned /TYPEOFDATA=STRING D
Call Rtrbroadcastevent
Parameters for rtrclosechannel
Call Rtrclosechannel
Call Rtrclosechannel
Immediate IMMEDIATE=RTR$DEFAULTCHANNEL
This command closes the channel named ``client1
Call Rtrerrortext
Call Rtrerrortext
Parameters for rtrerrortext
STATUS=status-code No default
Parameters for rtrgettid
Call Rtrgettid
Call Rtrgettid
Tid e100b810,0,0,0,0,3bc5,6eb02001
Call Rtropenchannel
Call Rtropenchannel
Parameters for rtropenchannel
Parameter Name Parameter Value Example
Client Noclient
Concurrent D Noconcurrent
FACILITY=RTR$DEFAULTFACILITY D
FACILITYNAME=facility-name
HIGHBOUND=high-bound HIGHBOUND=max-val-for-key-type D
KEYn=keysegdesc
LOWBOUND=low-bound LOWBOUND=min-val-for-key-type D
PARTITIONNAME=partition-name
Standby D Nostandby
Call Rtrclosechannel
Parameters for rtrpreparetx
Call Rtrpreparetx
Call Rtrpreparetx
DATA=data
DATA=0
Prepare the current transaction with a reason
Parameters for rtrreceivemessage
Call Rtrreceivemessage
Call Rtrreceivemessage
26RTR Command Line Interface
Msgsb msgtype msglen usrhdl 0 tid
10 Parameters for rtrrejecttx
Call Rtrrejecttx
Call Rtrrejecttx
Call Rtropenchannel Call Rtraccepttx
Reject the current transaction with a reason
Call Rtrreplytoclient
Call Rtrreplytoclient message-field1 ,message-field2
11 Parameters for rtrreplytoclient
Accept Noaccept
12 Generated Format Strings
Following example replies a message to the client
13 Parameters for rtrrequestinfo
Call Rtrrequestinfo
Call Rtrrequestinfo
GETITM=item-name,item-name... No default
INFCLA=infoclass No default
SELITM=item-name No default
SELVAL=item-value No default
RTR Call RTRRECEIVEMESSAGE/CHANNEL=INFOCHAN/TIMEOUT
Message-field ,message-field2
Call Rtrsendtoserver
Call Rtrsendtoserver message-field1 ,message-field2
14 Parameters for rtrsendtoserver
Expendable Noexpendable
15 Generated Format Strings
Readonly Noreadonly
Examples
Call Rtrstarttx
Call Rtrstarttx
16 Parameters for rtrstarttx
Nested Transaction Usage
JOINTXID=txid-number
Nojointxid
Txidtype
Ddtm
Call Rtrrejecttx Call Rtraccepttx
=column =row
Clear
Clear
46RTR Command Line Interface
Facilityname
Create Facility
Create Facility facilityname
Default for role-list is ROUTER,BACKEND
RESOURCEMANAGER=resource-list
50RTR Command Line Interface
Disk-1, ... disk-n
Create Journal
Create Journal disk-1 ... ,disk-n
17 Platform Specific Information
Unix
Delete Journal Modify Journal Show Journal
Partitionname
Create Partition
Partitionname
Facility
Create Facility SET Partition
Define /KEY
Define /KEY key-name equivalence-string
Key-name
Key names
Equivalence-string
Echo D Noecho
RTR Define /KEY PF3 Show RTR /TERMINATE
RTR PF3
RTR Define /KEY PF1 Help /SETSTATE=GOLD /NOTERMINATE /ECHO
RTR Define /KEY PF1 Create /TERMINATE /IFSTATE=GOLD /ECHO
60RTR Command Line Interface
Delete Facility
Delete Facility facilityname
Create Facility Show Facility
Delete Journal
Delete Journal
64RTR Command Line Interface
Delete Partition
Create Partition Show Partition
Expression
Display BAR
Display BAR expression
CHARACTER=char
AVERAGE=keyword
Noaverage
SEPARATE=keyword
Noseparate
=column
TOTALIZE=keyword
Nototalize
=previous-column D
Display Numeric
Display Numeric expression
DECIMALS=decimal-places /DECIMALS=0 D
KeywordMeaning
=column /X=previous-column D
76RTR Command Line Interface
Display String
Display String expression
78RTR Command Line Interface
WIDTH=field-width /WIDTH=0 D
80RTR Command Line Interface
Display Symbolic
Display Symbolic expression text-string ,text-string
82RTR Command Line Interface
Text
Display Text
Display Text text
Node Nonode
Related Commands
Do operating-system-command
DCL-command
RTR DO/NODE=TR2,TR1 Show Logical Mylogical
Example
RTR DO/CLUSTER Show Time
Flush Namecache
Flush Namecache
file-spec
Execute
Execute file-spec
Exit
Exit
Extend Facility
Extend Facility facilityname
$ RTR RTR SET Environment /NODE=FE,FETRBE
BACKEND=FETRBE
$ RTR
ROUTER=FETRBE
Default for role-list is ROUTER,BACKEND
Create Facility Delete Facility Show Facility Trim Facility
Initialize Journal
LOG
LOG
RTR LOG/OUTPUT=RTRLOG.LOG Message check here
Disk-1 ... disk-n
Modify Journal
Modify Journal disk-1 ... ,disk-n
OpenVMS Example
RTR Modify Journal DISK1$/BLOCKS=3000/MAXIMUMBLOCKS=20000
Monitor-file-spec
Monitor
Monitor monitor-file-spec
IDENTIFICATION=process-id
Noidentification D
RTR Monitor TRAFFIC/COUNT=10/OUTPUT=PICTURE.LIS
Quit
Quit
Recall
Recall command-specifier
Command-specifier
Resourcename
Register Resource Manager Register RM
Resourcename
106RTR Command Line Interface
Scroll
Scroll direction amount
Direction
Amount
SET Environment
SET Environment
Cluster
NODE=node-list
SET Facility
SET Facility facility-name
Balance Nobalance
RTR SET Facility FINANCE/QUORUMTHRESHOLD=4
RTR SET Facility FINANCE/BALANCE
SET Link
SET Link link-name
Enable Disable
Suspect Nosuspect
RTR SET Link JOEY/ENABLE
RTR SET Link JOEY/AUTOISOLATE
SET LOG
SET LOG
RTR SET LOG/OPERATOR
RTR SET LOG/FILE=RTRLOG.LOG/OPERATOR
RTR SET LOG/NOFILE/NOOPERATOR
SET Mode
SET Mode
GROUP=user-id
Nogroup
RTR SET MODE/GROUP
RTR SET MODE/NOGROUP
SET Node
SET node
RTR SET Node /NOISOLATE
Partition-name
SET Partition
SET Partition partition-name
RECOVERYRETRYCOUNT=n
Restartrecovery
PRIORITYLIST=backend-node-list
Resume
Timeout
Suspend
SET Transaction
SET Transaction transaction-id
Facility FACILITY=RTR$DEFAULTFACILITY D
Usage Notes
Transaction-id
BEFORE=date
SINCE=date
Newstate
19 Valid Transaction State Changes
RTR SET Transaction /NEW=ABORT /CURRENT=VOTED /PART=DBPART
Channel-name
Show Channel
Show Channel channel-name
RTR$DEFAULTCHANNEL
RTR Show CHANNEL/ALLWINDOWS
Clichn
CLICHN2
Full none D
Show Client
Show Client
CLI
RTR Show CLIENT/FULL
TEST43
=column /Y=row
Show Display
Show Display
RTR MON Calls RTR Show DISPLAY/ALL
Display Numeric
Blank
WIDTH=9
RTR SET ENVIRONMENT/NODE=FE2,FE3 RTR Show Environment
Show Environment
Show Environment
Facility-name
Show Facility
Show Facility facility-name
State Nostated
RTR Show FACILITY/FULL/NODE=BRONZE
Link to Airola Frontend Yes Router Backend
RTR Show FACILITY/BALANCE
Show Journal
Show Journal
Create Journal Delete Journal Initialize Journal
Show KEY
Show KEY key-name
RTR Show KEY/FULL
Node-name
Show Link
Show Link node-name
Full
RTR Show LINK/FULL Iron
Show LOG
Show LOG
RTR Show LOG
Show Mode
Show Mode
RTR Show Mode
Show Node
Show Node
RTR Show Node
20 Key-Range States
Show Partition
Show Partition
21 Router Partition States
RTR Show PARTITION/ROUTER/FULL
RTR Show PARTITION/BACKEND
Show Partition
Show Process
Show Process
Processes Process-id Process Name
Show Requester
Show Resource Manager Show RM
Show RM resourcename
Rmid
Show RTR
Show RTR
Status D Nostatus
RTR Show RTR
Show Segment
Show Segment
RTR$DEFAULTFACILITY Unsigned Testfac Signed
22 Key-range States
Show Server
Show Server
Server Flags
RTR Show Server
SRV
RTR Show SERVER/FULL
Lowerserv
24 Transaction Invocation Types
Show Transaction
Show Transaction
25 Key-Range States
Key-Range States
RTR Show TRANSACTION/BACKEND/FULL
Receiving
Original
Spawn operating-system-command
Operating-system-command
Spawn
Noutput
Start RTR
Start RTR
ASTLM=ast-limit
BIOLM=io-buffered
174RTR Command Line Interface
PRCLM=subprocess-limit /PRCLM=10 D
Show RTR Stop RTR
Abort
Stop RTR
Stop RTR
Show RTR Start RTR
Trim Facility
Trim Facility facilityname
RTR RTR SET Environment /NODE=FE,FETRBE,NFE
FRONTEND=frontend-list
Nofrontend D
Unregister Resource Manager Unregister RM
Creating Monitor Pictures
Table A-1 Information Classes
Interactive Definition of a Monitor Picture
Example A-1 Interactive Picture Definition
Substitution Symbols
Table A-2 Substitution symbols
Arithmetic Expressions and Operators
Test Picture AT Some Data Item Other Data Item
Table A-3 Arithmetic Operators in Display Commands
Example A-2 Arithmetic Operators Examples
Aggregation of Data Items
Some output has been omitted for clarity
Page
Shadow Events
Automatic Features
Primary and Secondary Roles
Server Shadowing and Recovery Automatic Features
RTR Journal System
Server Shadowing and Recovery RTR Journal System
Shadow Site Failure and Journaling
Standby for Shadows
Performance
Application Considerations
Server Shadowing and Recovery Performance
Shadows in Action
CHAN2
Server Shadowing and Recovery Application Considerations
Server States
Server Shadowing and Recovery Server States
Figure B-2 Server States
Server Shadowing and Recovery Client States
Client States
Requester State Transitions
CHAN3
Server Shadowing and Recovery Partition States
Partition States
Page
New Qualifier to Create Facility Command
XA Support
Microsoft DTC Support
XA Support Introduction
Modified RTR API
RTR Open Channel
RTR Utility Error Messages
RTR Utility Error Messages
RTR Utility Error Messages D-3
4RTR Utility Error Messages
RTR Utility Error Messages D-5
6RTR Utility Error Messages
RTR Utility Error Messages D-7
8RTR Utility Error Messages
RTR Utility Error Messages D-9
Explanation
RTR Utility Error Messages D-11
12RTR Utility Error Messages
RTR Utility Error Messages D-13
Blocks
RTR Utility Error Messages D-15
16RTR Utility Error Messages
RTR Utility Error Messages D-17
18RTR Utility Error Messages
RTR Utility Error Messages D-19
20RTR Utility Error Messages
RTR Utility Error Messages D-21
22RTR Utility Error Messages
RTR-S-RTRLOGENT, a
24RTR Utility Error Messages
RTR Utility Error Messages D-25
26RTR Utility Error Messages
RTR log messages
2RTR log messages
RTR log messages E-3
4RTR log messages
RTR-I-FACSTOPPED, Facility a stopped on local node
6RTR log messages
RTR-I-LOGFILENT, a a a
8RTR log messages
RTR log messages E-9
10RTR log messages
RTR log messages E-11
12RTR log messages
RTR log messages E-13
Page
Index
Index-2
Index-3
Index-4