| The IRM2 Chassis View |
Out Octets | The number of bytes transmitted by this interface, |
| expressed as a percentage of the theoretical maximum |
| load. |
When you select this option, a Bar Graph field will be added to the interface display area; this field is only available when Load is the selected base unit.
Rate
The count for the selected statistic during the last poll interval. The available parameters are the same as those provided for Raw Counts. Refer to the Raw Counts section, above, for a complete description of each parameter.
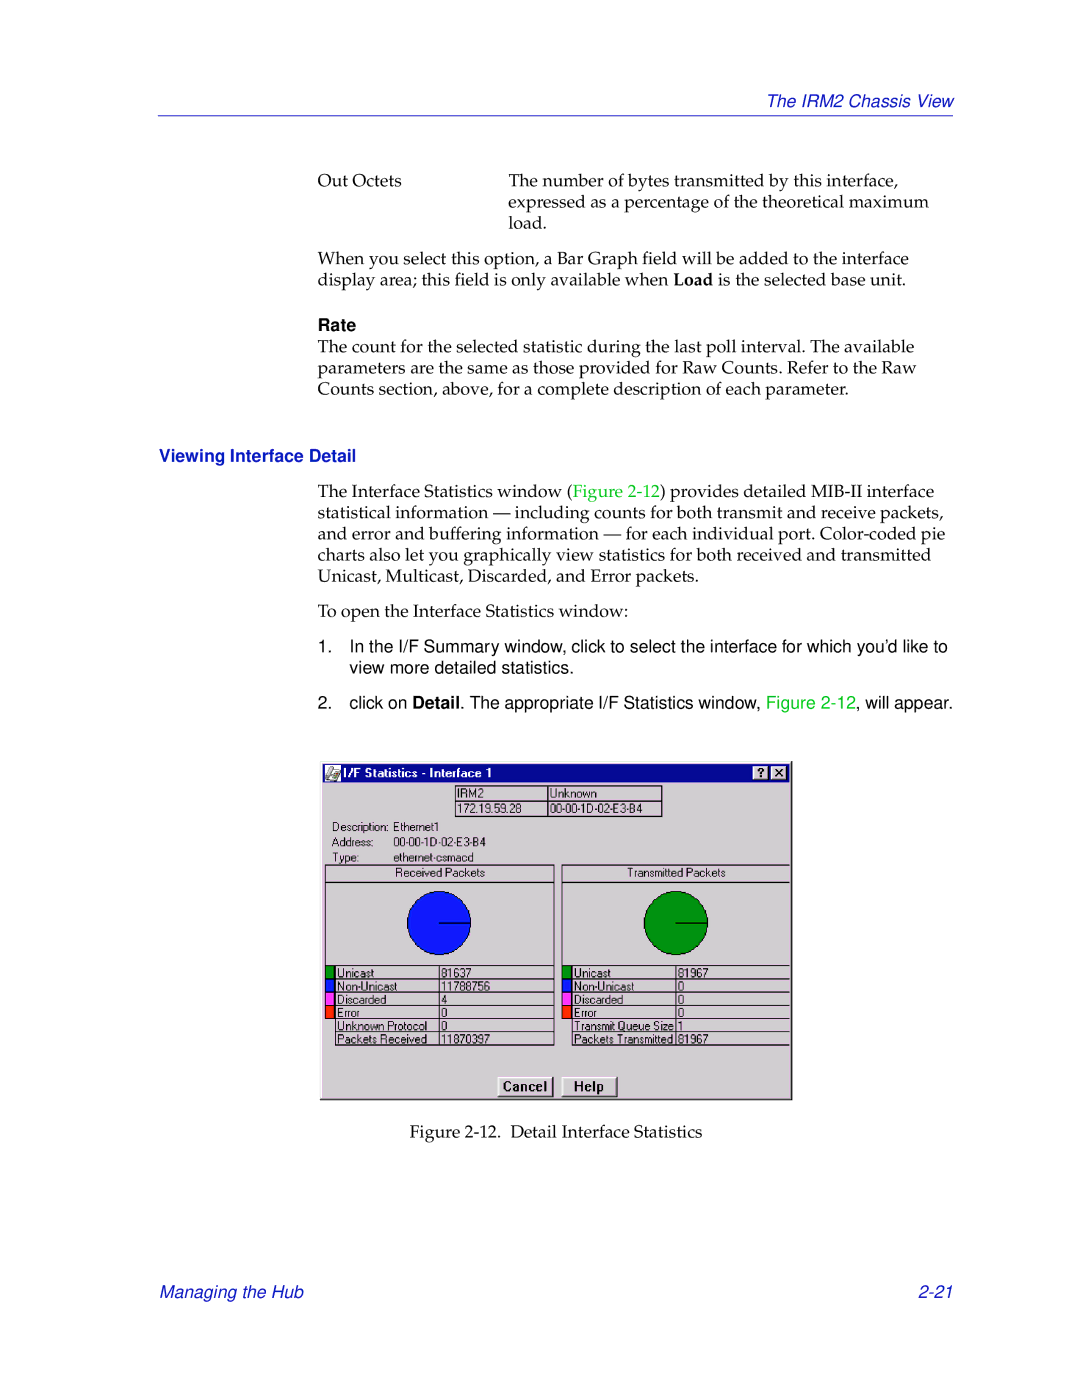
Viewing Interface Detail
The Interface Statistics window (Figure
To open the Interface Statistics window:
1.In the I/F Summary window, click to select the interface for which you’d like to view more detailed statistics.
2.click on Detail. The appropriate I/F Statistics window, Figure
Figure 2-12. Detail Interface Statistics
Managing the Hub |