Statistics
1.Click on Repeater on the Chassis View menu bar to display the repeater menu.
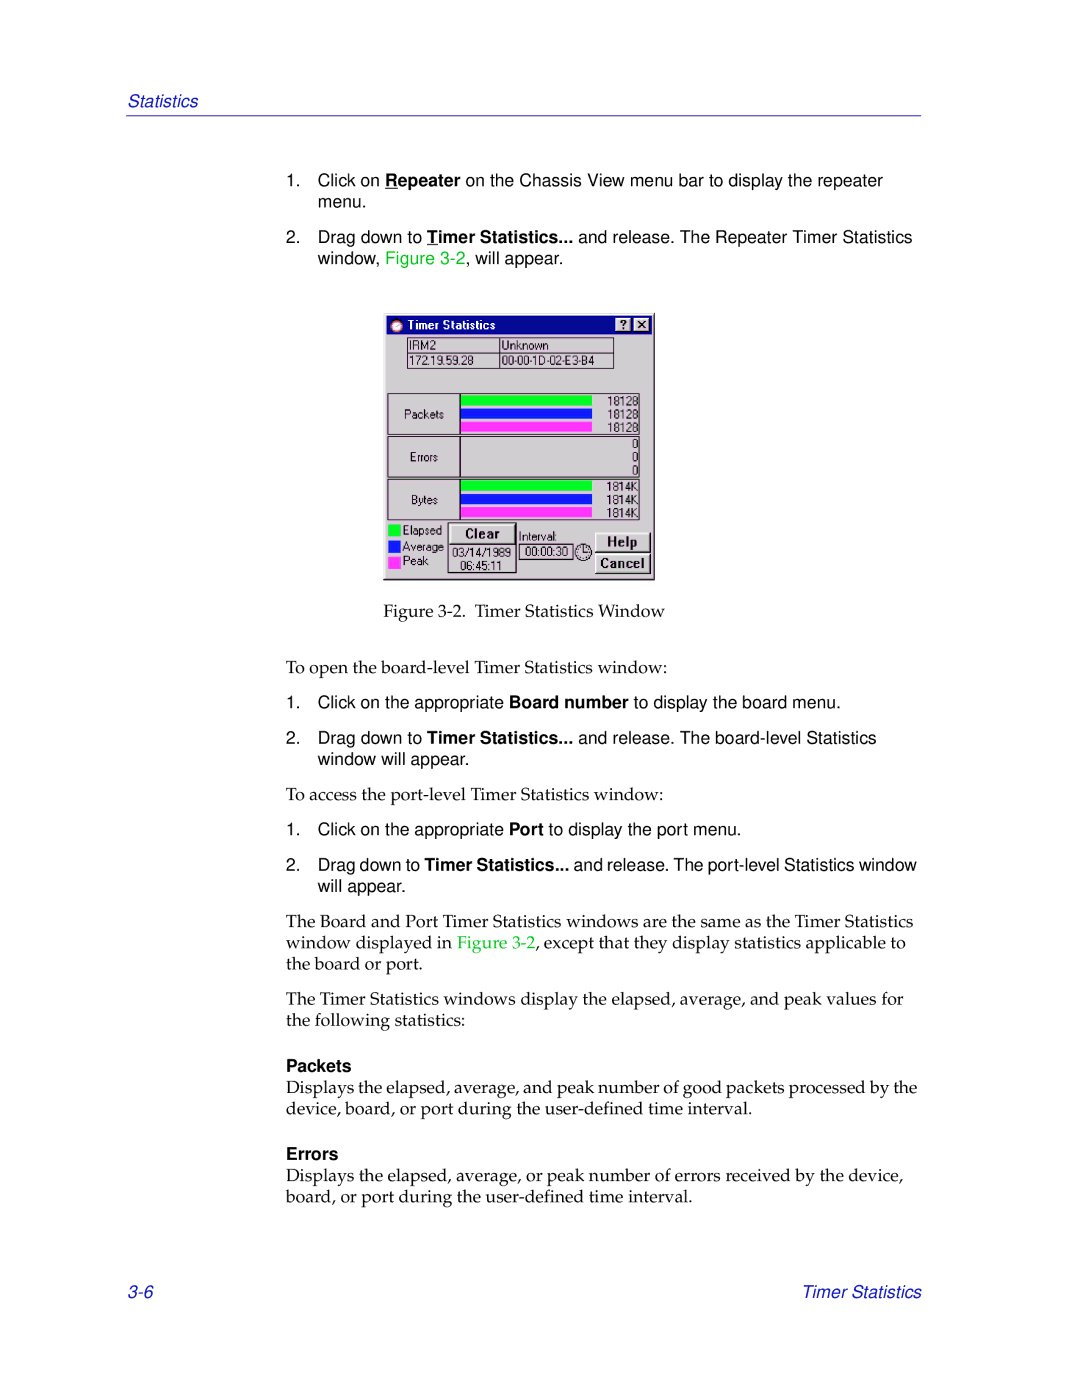
2.Drag down to Timer Statistics... and release. The Repeater Timer Statistics window, Figure
Figure 3-2. Timer Statistics Window
To open the board-level Timer Statistics window:
1.Click on the appropriate Board number to display the board menu.
2.Drag down to Timer Statistics... and release. The
To access the port-level Timer Statistics window:
1.Click on the appropriate Port to display the port menu.
2.Drag down to Timer Statistics... and release. The
The Board and Port Timer Statistics windows are the same as the Timer Statistics window displayed in Figure
The Timer Statistics windows display the elapsed, average, and peak values for the following statistics:
Packets
Displays the elapsed, average, and peak number of good packets processed by the device, board, or port during the
Errors
Displays the elapsed, average, or peak number of errors received by the device, board, or port during the
Timer Statistics |