Statistics
Bytes
Displays the elapsed, average, or peak number of bytes processed by the device, board, or port during the
Setting the Timer Statistics Interval
To set the Timer Statistics time interval:
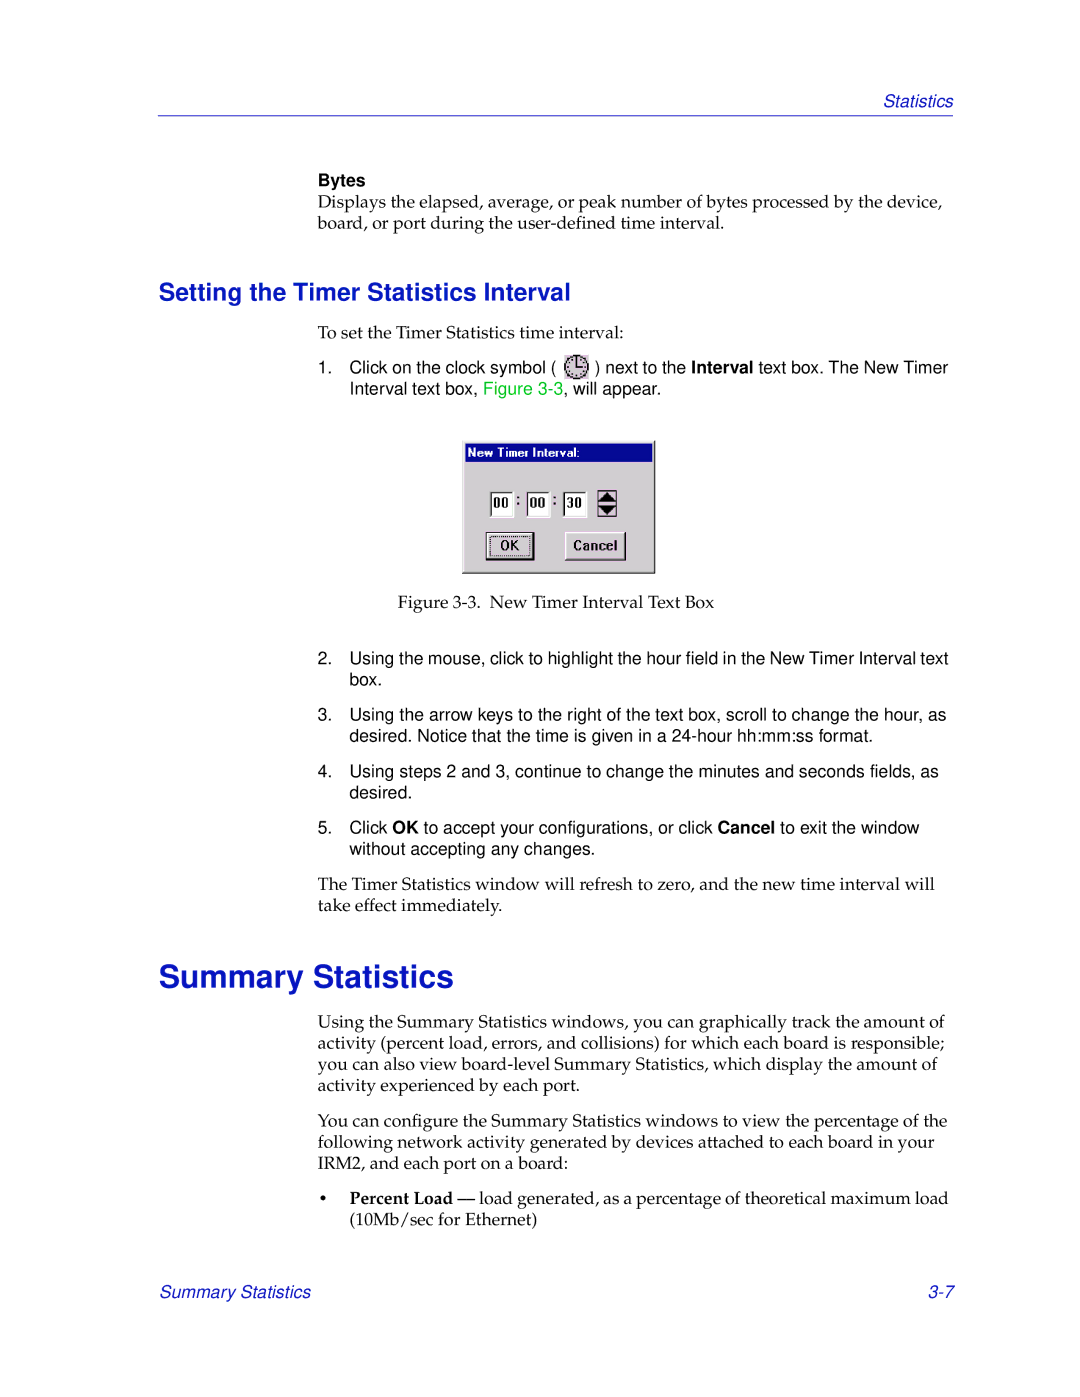
1.Click on the clock symbol ( ![]() ) next to the Interval text box. The New Timer Interval text box, Figure
) next to the Interval text box. The New Timer Interval text box, Figure
Figure 3-3. New Timer Interval Text Box
2.Using the mouse, click to highlight the hour field in the New Timer Interval text box.
3.Using the arrow keys to the right of the text box, scroll to change the hour, as desired. Notice that the time is given in a
4.Using steps 2 and 3, continue to change the minutes and seconds fields, as desired.
5.Click OK to accept your configurations, or click Cancel to exit the window without accepting any changes.
The Timer Statistics window will refresh to zero, and the new time interval will take effect immediately.
Summary Statistics
Using the Summary Statistics windows, you can graphically track the amount of activity (percent load, errors, and collisions) for which each board is responsible; you can also view
You can configure the Summary Statistics windows to view the percentage of the following network activity generated by devices attached to each board in your IRM2, and each port on a board:
•Percent Load
Summary Statistics |