Statistics
•Percent Errors
•Percent Collisions
The dynamic bar graphs allow you to immediately observe the amount of activity experienced by each board or port; the scale displayed at the top right of the window indicates the percentage of activity represented by the bar.
Accessing the Summary Statistics Windows
To access the
1.Click on Repeater on the Chassis View menu bar to display the repeater menu.
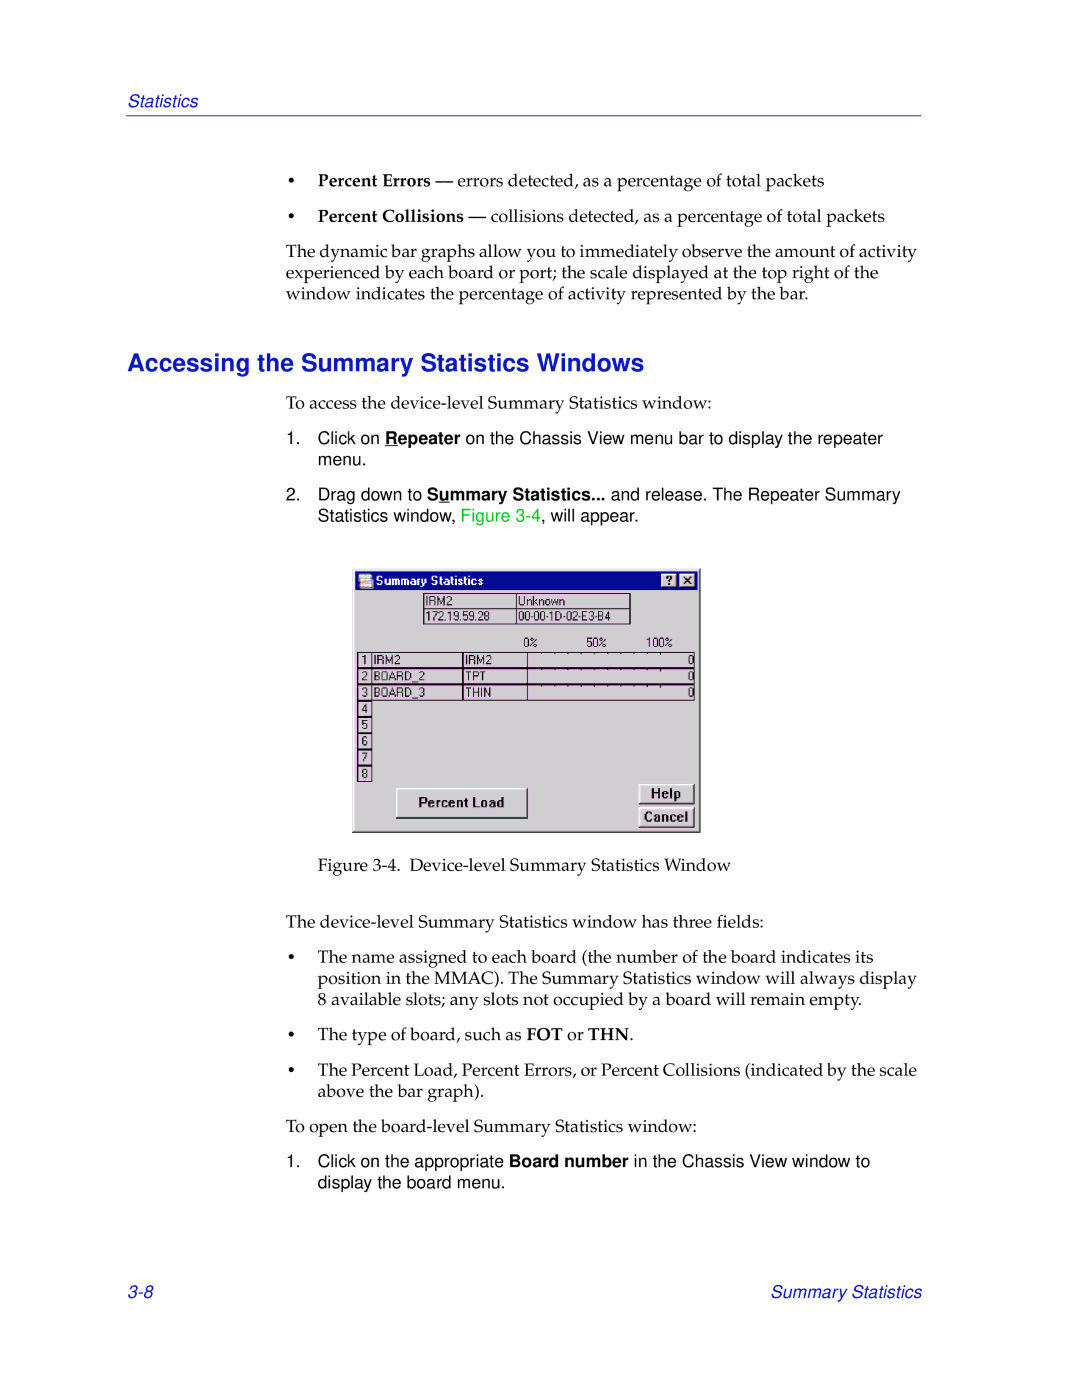
2.Drag down to Summary Statistics... and release. The Repeater Summary Statistics window, Figure
Figure 3-4. Device-level Summary Statistics Window
The device-level Summary Statistics window has three fields:
•The name assigned to each board (the number of the board indicates its position in the MMAC). The Summary Statistics window will always display 8 available slots; any slots not occupied by a board will remain empty.
•The type of board, such as FOT or THN.
•The Percent Load, Percent Errors, or Percent Collisions (indicated by the scale above the bar graph).
To open the board-level Summary Statistics window:
1.Click on the appropriate Board number in the Chassis View window to display the board menu.
Summary Statistics |