Statistics
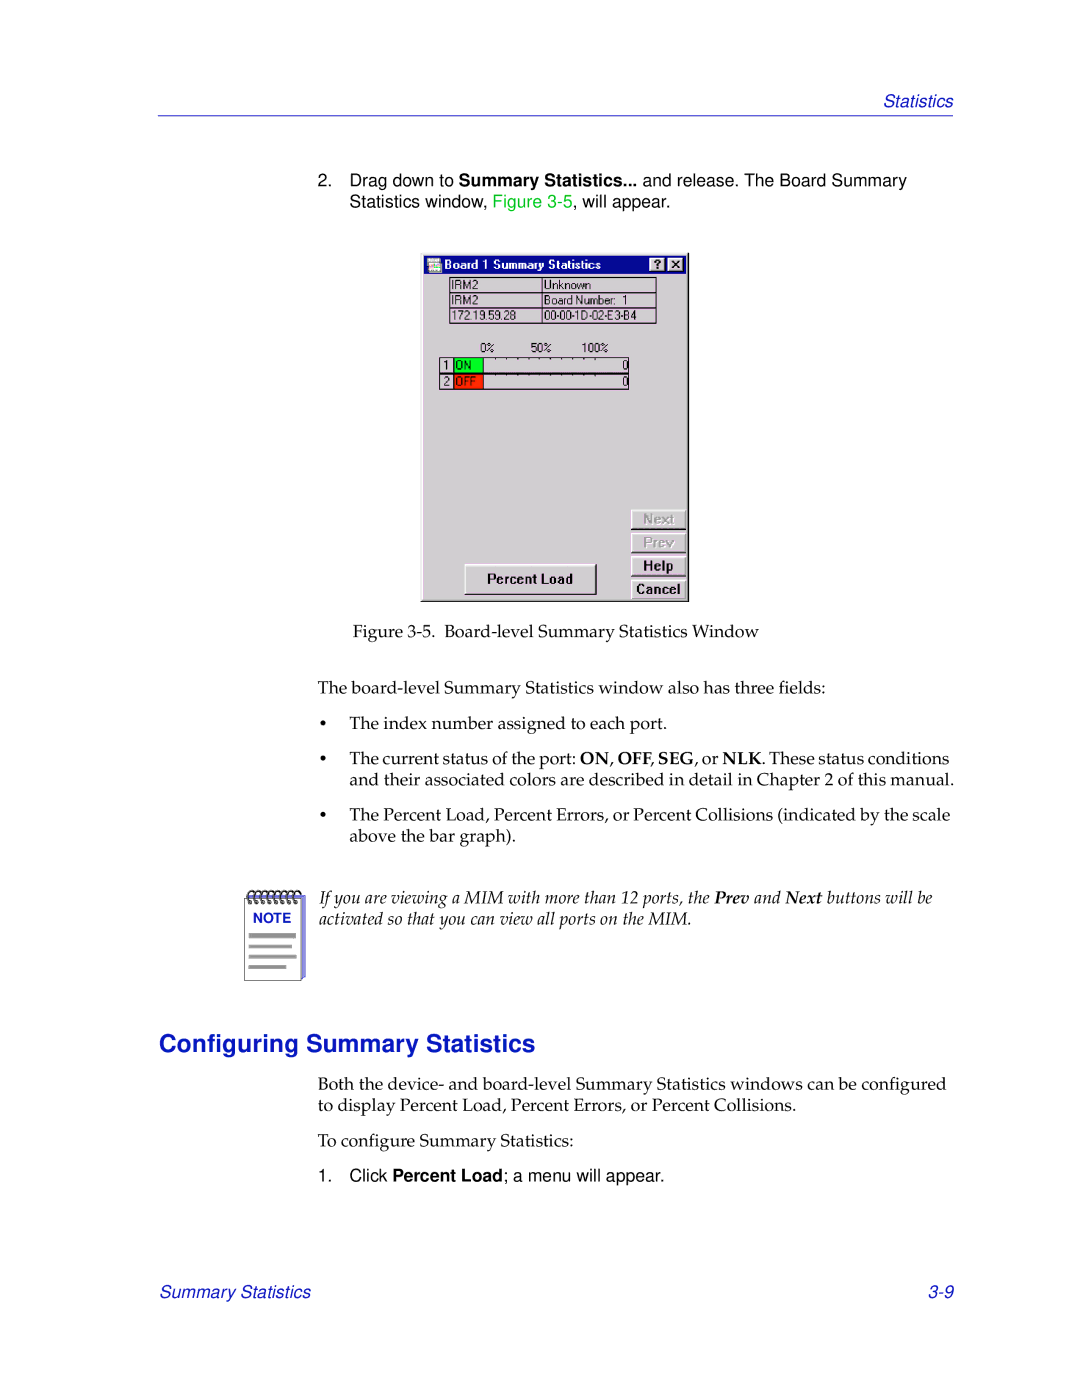
2.Drag down to Summary Statistics... and release. The Board Summary Statistics window, Figure
Figure 3-5. Board-level Summary Statistics Window
The board-level Summary Statistics window also has three fields:
•The index number assigned to each port.
•The current status of the port: ON, OFF, SEG, or NLK. These status conditions and their associated colors are described in detail in Chapter 2 of this manual.
•The Percent Load, Percent Errors, or Percent Collisions (indicated by the scale above the bar graph).
NOTE |
If you are viewing a MIM with more than 12 ports, the Prev and Next buttons will be activated so that you can view all ports on the MIM.
Configuring Summary Statistics
Both the device- and
To configure Summary Statistics:
1. Click Percent Load; a menu will appear.
Summary Statistics |