2620A/2625A
Limited Warranty & Limitation of Liability
Table of Contents
2620A/2625A
Operating the Instrument from the Front Panel
Additional Considerations
Index
List of Tables
Performance Tests Voltage, Resistance, and Frequency
List of Figures
Interference Information
Safety Terms in this Manual
Symbols Marked on Equipment
2620A/2625A AC Power Source
DC Power Source
Use the Proper Power Cord
Use the Proper Fuse
Setting Up a Channel
Getting Started
Introduction
Basics
Selecting the Scan Data Destination
Taking Measurements
Viewing Minimum, Maximum, and Last Data Values
Last MIN MAX
Xvi
Introduction
2620A, 2625A
Hydra Series II Data Acquisition Unit
Options and Accessories
Hydra Series II Data Logger
Hydra Features
Where to go From Here
Accessories
Accessories Description
Model
Using the Computer Interface
Maintenance
Getting Started
Introduction
Overview
2620A, 2625A
Setting Up the Instrument
Adjusting the Handle
Introduction
Unpacking and Inspecting the Instrument
Line Power
Front/Rear Panel Features
Active Mode Buttons
Power Button PRINT/COMMUNICATIONS Buttons
Instrument Configuration Buttons
Channel Configuration Buttons
Auto MON
REM Scan SET
MON Scan SET
Func Alarm OFF Auto Limit
Display Annunciators
HI, LO Review MIN, MAX Last PRN
EXT REM CAL
Turning the Instrument On
Operating Modes
Input Channels
Front Panel Display
Reading the Display
Left Display
Right Display
Using the Buttons
Front Panel Buttons
Selecting a Channel
Front Panel Pushbuttons
Setting up a Channel
Setting up a Channel
Setting Alarm Limits and Mx+B Scaling Values
Alarm Limits
Setting the Scan Interval
Mx+B Scaling
Using the Scan Function
Using the Monitor Function
Reviewing Channel Data
Using External DC Power
Viewing the Totalizer Count
Activate
Review Array Review Points
Using the Rack Mount Kit
Operating the Instrument from the Front Panel
Entering and Changing Numeric Values
2620A, 2625A
Configuration Mode
Channel Configuration
What is the Present Configuration?
Other Displayed Data
Power on
Configuration Reset Settings
Digital I/O Line Assigned to Channels
DC Voltage, AC Voltage Function Range
Press These Buttons OFF
Select
From
Resistance
Frequency
Press Buttons OFF Select
Alarm Limits
Setting Alarms
RTD Temperature Type Terminals
Alarm Indications
Alarm Selection ChannelAlarm
Resetting Alarm Conditions
Using the Digital I/O Lines
Initial Alarm Assignments, Digital I/O Lines 4 Through
To define the scaling values
Page
Instrument Configuration
Entering and Changing Numeric Values
Press These Buttons To Select
Sign, M Decimal Multiplier Value Point Position
Selecting Scan Interval
Selecting the Measurement Rate
Hour
10. Scan Interval Minute
Changing the Temperature Unit
Triggering
External Triggering
11. Measurement Rate Selection
Setting Date and Time of Day
Measurement Connections
Date/Time Selection Year Month.Day Hour.Minut
Mn.dY Hr.nn
DC Volts, AC Volts, Frequency, and Thermocouples
Strain Relief
Input Module Connections
Resistance and RTD
14. Thermocouple Ranges Positive Lead Type Material
Positive Lead Color
Negative Lead Material
11 12 13 14 15 16 17 18 19
11 12 13 14 15 16 17 18 19 3 4 5 6 7 8 9
Totalizing
Review Array
General
Connections
List Button Functions
Activate Note 15. Review Array Review Points
16. List Button Operation
Autoprint
Memory Storage
Front Panel Review Only Function
Front Panel Lock out Conditions
Front Panel Monitor Only Function
Calibration
REM Annunciator
Computer Interface-Initiated Lockouts
2620A, 2625A
Using the Computer Interface
Computer Interface Command Set
Front Panel and Computer Interface Operations
Using the RS-232 Computer Interface
Types of Computer Interface
Parity = E or Odd
Setting Communication Parameters RS-232
Parity = No
Autoprint Computer Interface Control
Autoprint and Memory Storage RS-232
Autoprint Output Format
Memory Storage Computer Interface Control
Memory Retrieval
Clearing Memory
Memory Full Operation
Cabling the Instrument to a Host or Printer RS-232
Installation Test
Device Clear Using Ctrl C
RS-232 Information
Character Echoing
Using the IEEE-488 Interface
Sample Program Using the RS-232 Computer Interface
Installing the IEEE-488 Interface
RS-232 Prompts
Sample Program
Gosub
IEEE-488 Setup BaudAddress
Enabling the IEEE-488 Interface
Capability
IEEE-488.1 Capabilities Description
General Information RS-232 and IEEE-488
How the Instrument Processes Input
Input Terminators
Input Strings
Typical Input Strings
Func 1, TEMP, PT, 2 RTDR0 12
Func 1, OHMS, 3
Intvl 0, 10, 0 Scan 1 LAST?
Sending Input Strings to the Instrument
How the Instrument Processes Output
Service Requests IEEE-488 only and Status Registers
ESB
Event Status and Event Status Enable Registers
Status Byte Register
Bit Name
Status Byte Register Description
Reading the Status Byte Register
Event Status Register Description
Service Request Enable Register
Instrument Event Register
Computer Interface Command Set
Instrument Event Register IER
Command and Query Summary
Lock
LOCK?
Rate
RATE?
Tempconfig TEMPCONFIG?
Format FORMAT?
Reviewclr
Intvl INTVL? Scan SCAN? SCANTIME?
ESE? ESR? IDN? OPC OPC? RST
Command and Query Reference
Field Description
Computer Interface Command Set
SRE? STB? TRG TST?
ALARMS?
Limit ALARMASSOC? channel,limitnum Channel
LO OFF
Date
Dolevel Echo Format
FORMAT? Func Measurement Units String
VDC
VAC
Ohms
FUNC? IEE
TEMP, VAC, VDC, OHMS, FREQ, OFF
IEE? IER? Intvl INTVL? LAST?
Lock LOCK? Locs LOG?
LOGGED? LOGBIN? Logclr LOGCOUNT?
Logmode LOGMODE? Lwls MAX?
MON MONCHAN? MONVAL?
Print PRINT? Printtype
Store Scans
Rate RATE?
RTDR0 RTDR0?
Code Display MAX Offset Value
Scan SCAN? SCANTIME? Tempconfig
TEMPCONFIG? Time TIMEDATE?
Total TOTAL? Totaldbnc TOTALDBNC? Trigger
Returns an integer representing the present trigger type
Additional Considerations
2620A, 2625A
Measurement Rate
Advanced Trigger Mechanisms
Front Panel Trigger Control
Computer Interface Trigger Control
Both External and Monitor Alarms Disabled Type
External Trigger Enabled Type
High Valid External Triggers Scan Time
LOW Ignored Scan Falling Progress Edge
Monitor Alarm Enabled Type
When Measuring Resistance or Temperature RTD
Thermal Voltages
When Measuring Resistance or Temperature Rtd
True RMS Measurements
Effects of Internal Noise in AC Measurements
Waveform Comparison True RMS vs Average Responding
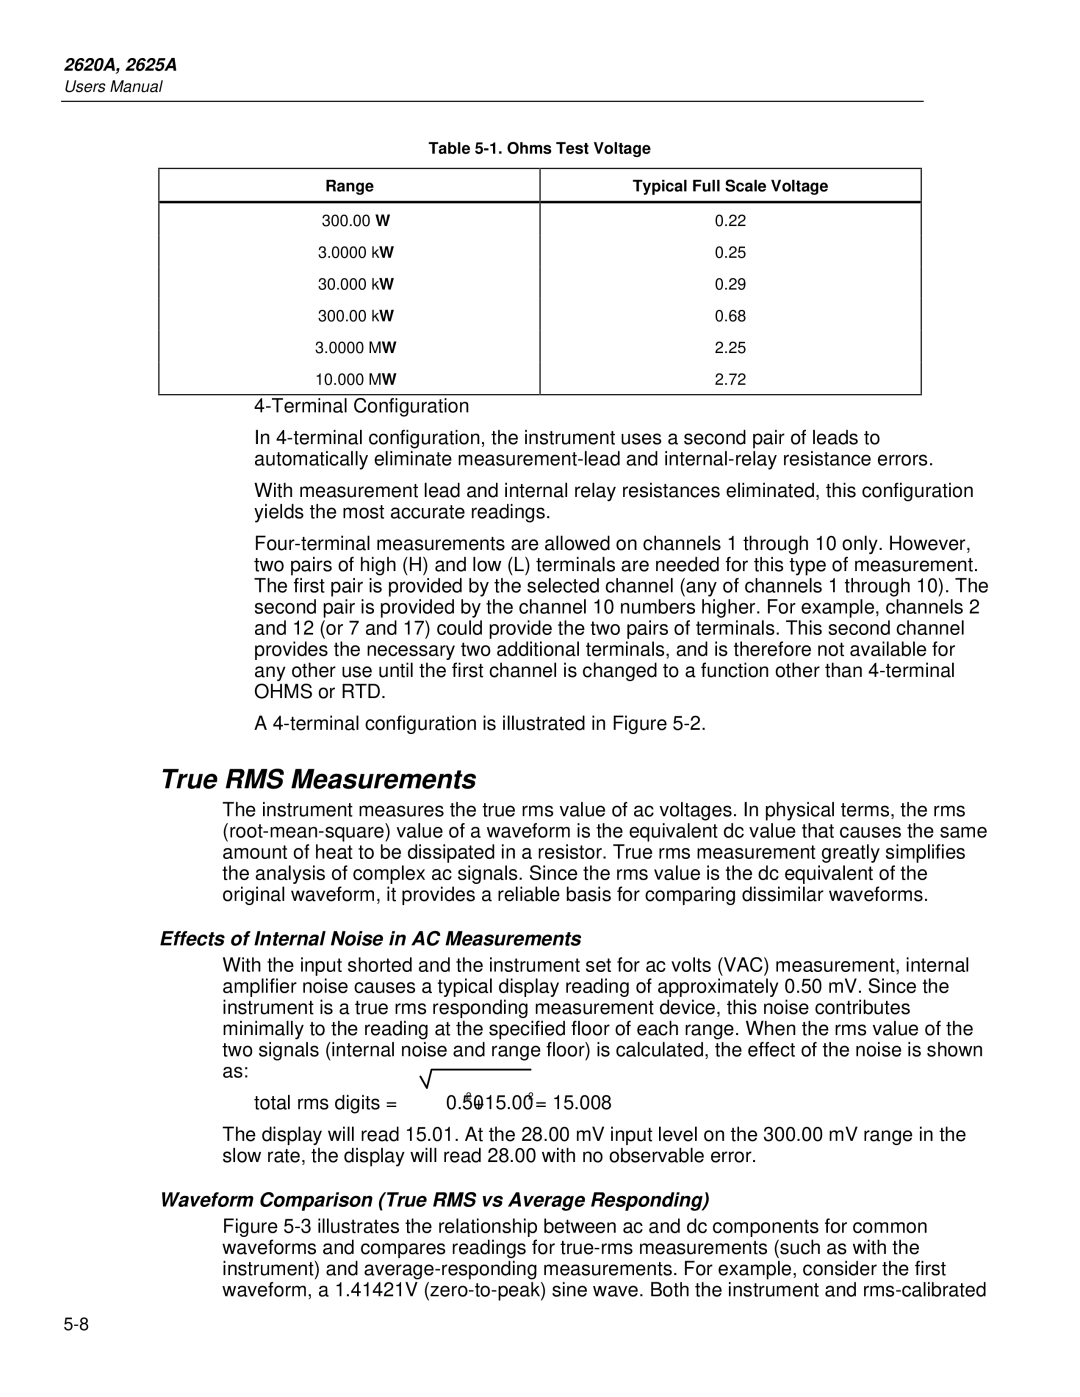
Ohms Test Voltage Range
Making Mixed Measurements
Comparison of Common Waveforms
Using Shielded Wiring
Non-Isolated Sensor Configuration
Isolated and Shielded Sensor Configuration
General Rule
More Detail
Maintenance
Thermocouple Measurement Range Accuracy Test
2620A, 2625A
Self-Test Diagnostics and Error Codes
Introduction Cleaning
Line Fuse
Performance Tests
Replacing the Line Fuse
Error Power-Up Error Codes Description
Performance Tests
Recommended Test Equipment Minimum Specification
Instrument Type
Recommended Model
Instrument Type Recommended Model
Accuracy Verification Test
Channel Integrity Test
MIN MAX
Thermocouple Measurement Range Accuracy Test
Performance Tests Voltage, Resistance, and Frequency
Func 0,VDC,I100MV CR MON 1,0 CR MONVAL? CR
Terminal Resistance Test
Thermocouple Temperature Accuracy Test
Wire
5700A
OFF Comp
Sense Source
Open Thermocouple Response Test
Decade Resistance BOX Hydra Input Module
RTD Temperature Accuracy Test
Year @ 18-28C
Digital Input/Output Verification Tests
RTD Temperature Accuracy Test Using DIN/IEC
Year @ 18-28 Degrees C
Digital Output Test
Digital Input Test
Totalizer Test
Digital Input Values
Dolevel 0,0 CR Dolevel 0,1 CR
Totalizer Sensitivity Test
Dedicated Alarm Output Test
Dedicated Alarms Output Test
2 3 4 5 6 7 Σ + 0 1 2 3 TR
External Trigger Input Test
2 3 4 5 6 7 Σ
Service
Variations in the Display
Appendices
Appendix Title
Page
Accuracies at Ambient Temperatures Other Than Specified
Specifications
Response Times
DC Voltage Inputs
Thermocouple Inputs
Year Slow Year Fast
2620A/2625A
Common Mode and Normal Mode Rejection
RTD Inputs
Open Thermocouple Detect
Type
Wire Accuracy
Range Resolution Slow Fast
AC Voltage Inputs
IEC 751, Amendment 2, 100 e Platinum ITS-90
Range Frequency Year Accuracy ±% ± 18C to 28C 0C to 60C
Slow Fast
Crest Factor Error
DC Component Error
Maximum Crest Factor
Maximum AC Input
Input Protection
Ohms Inputs
Maximum Current Through Unknown
Range Resolution Accuracy + % ± Hz Slow Fast
Frequency Inputs
Frequency Range
Sensitivity
VDC Temperature VAC Ohms Frequency
Typical Scanning Rate
Auto PT RTD
Auto
Totalizing Input
Maximum Autoranging Time
Digital Inputs
Trigger Input
Input Voltages
Minimum Pulse Width Maximum Frequency Specified Conditions
Maximum Latency
Real-Time Clock and Calendar
Digital and Alarm Outputs
Environmental
General
2625A Data Storage
2620A Options
Ascii & IEEE-488 Bus Codes
KEY
IEEE-488.2 Devise Documentation Requirements
Implementation of Ieee Standard
Program Message Program Message Terminator
ALARMLIMIT?
*RDT and *RDT? commands are not implemented
Operation complete is generated when the command is parsed
2620A/2625A
Signal Cross Talk in a DC Voltage Channel
Making Mixed Measurements
AC Signal Cross Talk Into an Ohms Channel
AC Signal Cross Talk Into an AC Voltage Channel
AC Signal Cross Talk Into a Frequency Channel
AC Signal Crosstalk Into a Temperature Channel
2620A/2625A
Binary Upload of Logged Data LOGBIN? 2625A only
Decoding the Ascii String
Figure E-1. Ascii String Decoding
Floating Point Conversion
Example
Figure E-2. Floating Point Conversion
Figure E-3. Example
Connections
RS-232 Cabling
Cables
Figure F-1. Summary of RS-232 Connections
Figure F-2. Hydra DB-9 to PC DB-9 RS-232 Connection Generic
Figure F-3. Hydra DB-9 to PC DB-25 RS-232 Connection
Figure F-4. Hydra DB-9 to Modem DB-25 RS-232 Connection
Figure F-5. Hydra DB-9 to Printer DB-25 RS-232 Connection
Side Male Female
Connector
Side
2620A/2625A
Temperature Units
Scan Rate
Communication I/F
Output
Index
2620A/2625A