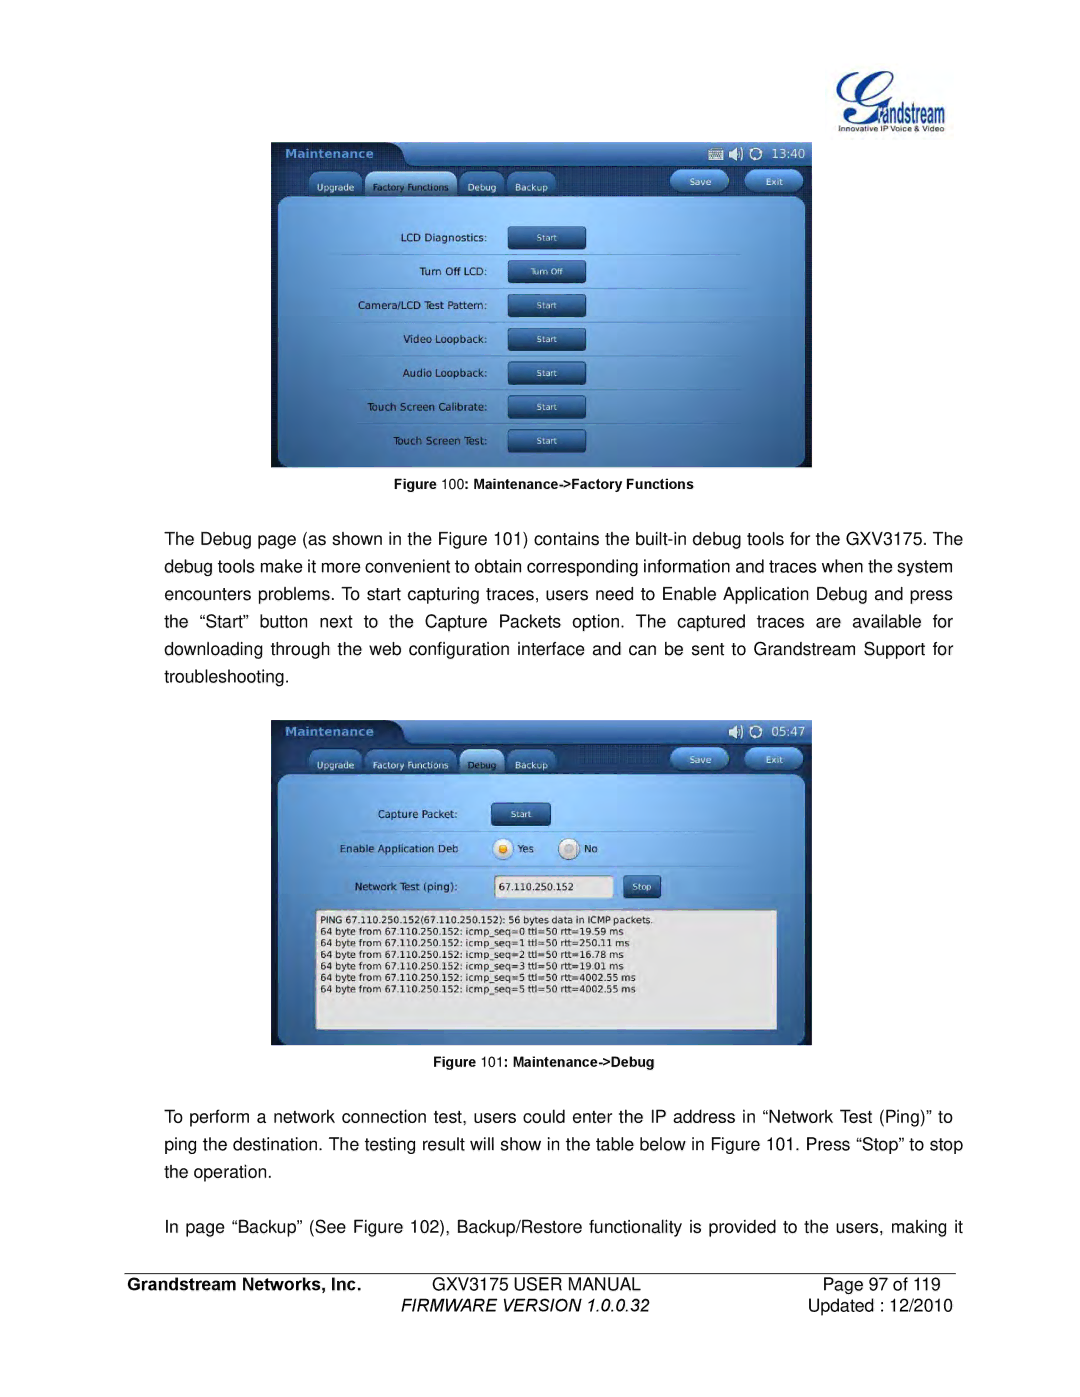
Figure 100: Maintenance->Factory Functions
The Debug page (as shown in the Figure 101) contains the
Figure 101: Maintenance->Debug
To perform a network connection test, users could enter the IP address in “Network Test (Ping)” to ping the destination. The testing result will show in the table below in Figure 101. Press “Stop” to stop the operation.
In page “Backup” (See Figure 102), Backup/Restore functionality is provided to the users, making it
Grandstream Networks, Inc. | GXV3175 USER MANUAL | Page 97 of 119 |
| FIRMWARE VERSION 1.0.0.32 | Updated : 12/2010 |
