Users Reference Manual
Page
Users Reference Manual
Trademark Acknowledgements
Table of Contents
Configuration
Operation
Vertical Format Units
Dvfu
Programming
Interfaces
Installation
Switches and Indicators
About This Manual
Viii P3000 Series Multinational User’s Refernce Manual
Chapter Overview
Introduction
Features
Optional Features
Character Formation
Line Matrix Printing
Print Rate
Plot Rate
Plot Rates Density dpi P3000 Plot Rates Ipm
Overview
Chapter Operation
Basic Operation Features
Command Sets Protocol Modes
On Line
Off Line
Power Switch
Power Switch
Control Panel Switches and Indicators
Alphanumeric Message Display
LPI Switch
On Line Switch
Clear Switch and Check Indicator
Menu UP, Menu DOWN, NEXT, and Prev Switches
Paper ADV Switch
VFU Loaded Indicator
Mode Switch
Switch
Enter Switch
Barcode 145 at 12.1 cpi Barcode 160 at 13.3 cpi
Loading Paper
Loading Paper
Unloading Paper
Replacing the Ribbon
Setting Top-Of-Form
Ribbon Replacement
Setting Top-of-Form Forward Paper Motion
Setting Top-of-Form
Setting Top-of-Form Reverse Paper Motion
Paper Stacking Floor Cabinet Model
Setting Forms Length
To Set Forms Length in Inches
Selecting Print Mode
To Set Forms Length in Lines
Setting Line Spacing
Printer Reset
Operation
Configuration Menus
Chapter Configuration
Lock/Unlock Printer Configuration
Configuration Printout
Sample Configuration Printout
Factory Default Configuration Values
Printronix Factory Default Configuration Values
Configuration Procedure
Load Configuration Values
Control Panel Configuration Diagram
Level II Main Configuration Menus
Level III Configuration Menu Parameters
Level I Print Format
Level III Configuration Menu Parameters
DSR
P3000 Control Panel Configuration Diagram Symbols
Level
Control Panel Configuration Diagram sheet 1
Level I Print Format
Level II Main Configuration Menus
Control Panel Configuration Diagram sheet 2
Control Panel Configuration Diagram sheet 3
Level III Configuration Menu Parameters
Control Panel Configuration Diagram sheet 4
Control Panel Configuration Diagram sheet 5
Control Panel Configuration Diagram sheet 6
LF = LF Dvfu Save Saved VFU Select Disable
Control Panel Configuration Diagram sheet 7
Inches Perforation Skip
Control Panel Configuration Diagram sheet 8
Control Panel Configuration Diagram sheet 9
Control Panel Configuration Diagram sheet 10
Control Panel Configuration Diagram sheet 11
Control Panel Configuration Diagram sheet 12
Control Panel Configuration Diagram sheet 13
Load IGP Completed
Control Panel Configuration Diagram sheet 14
Control Panel Configuration Diagram sheet 15
Configuration
Plotting a Bit Image Pattern
Chapter Graphics
Serial Matrix Compatible Bit Image Graphics
How Bit Image Graphics Are Produced
Bit Image Pattern Plan
Bit Image Density
Control code ESC K selects the Single Density Mode
Control code ESC L selects the Double Density Mode
ESC CCn1n2DATA where
Control code ESC Z selects the Quadruple Density Mode
Bit Image Programming Format
Plot Density
Series Compatible Plot Mode
Bit Image Sample Program
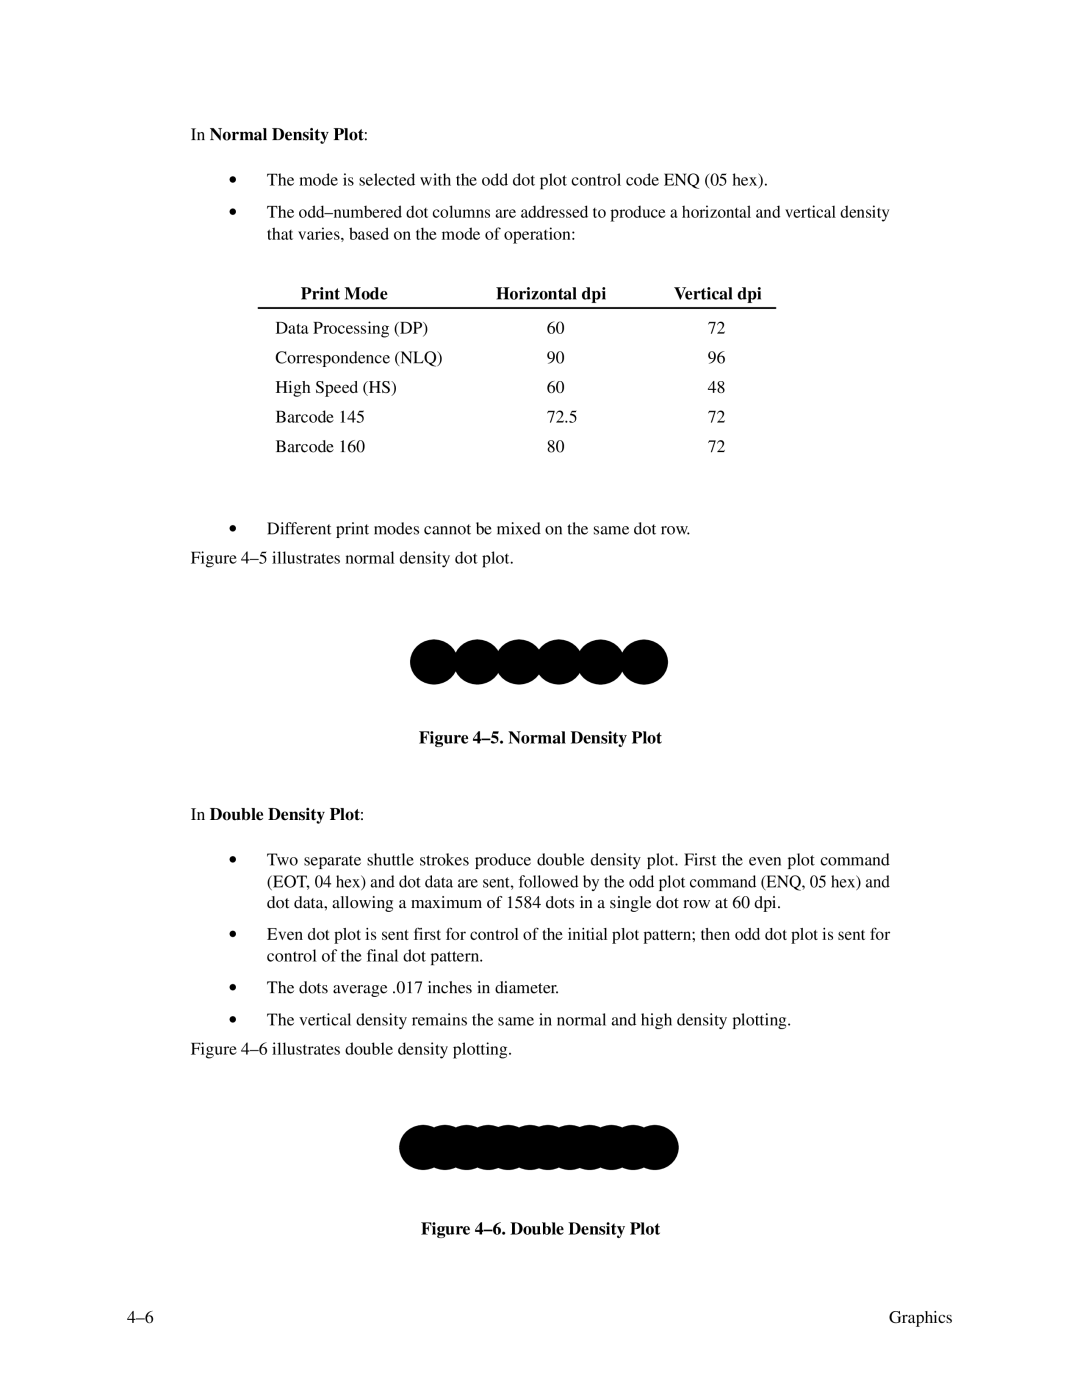
Print Mode Horizontal dpi Vertical dpi
Normal Density Plot
~~~ ~~~~~~~~~~~
Plot Data Line Format
Normal Density Plot
Plotting the Data
Odd Dot Plot Pattern Plan
Sample Odd Dot Plot
Plot Data Byte Dot Patterns
To Exit the P-Series Plot Mode
Combining Graphics and Text
Chapter Vertical Format Units
General VFU Programming
Series Evfu
VFU Load/Save/Clear
Start Load Code 1E or 6E Hex
Channel Assignment
Using the Evfu
End Load 1F or 6F Hex
P-Series Evfu Codes PI Line Enabled
Data Bits Channel Hex Dec Code
P-Series Evfu Codes PI Line Disabled or Not Used
Clearing the Evfu Memory
Data Bits Lines Slewed Hex Dec Code
Relative Line Slewing
P-Series Evfu Line Slewing
Dvfu
Start Load Code 6C, 6D, or 6E Hex
Using the Dvfu
End Load Code 6F Hex
Clearing the Dvfu Memory
Dvfu Channel Instruction
Serial Matrix Vertical Formatting
P-Series Dvfu Line Slewing
Form Data Form Line Number Vertical Tabs
Vertical Tab Positions
Executing Vertical Tabs
Vertical Format Units
Enter in Print Buffer Printed Result
Overstrike/Overlay Mode
Chapter Programming
Control Code Functions
Special Function Control Code Control Code Header
Hex 01
Hex 1B
Error Message Explanation
Attribute Set and Reset Codes
Command Line Error Messages
Control Code Reference Index
Format Function Series Serial
Other Functions Series Serial
Function Series Serial
Example
Backspace
Hex Decimal Series Serial Purpose
Purpose Sounds a buzzer/beeper
Bell
Hex Decimal Series Serial
Bit Image Mode, Single Density
Expression
Where
Comment
Bit Image Mode, Double Density
Bit Image Mode, Double Density Double Speed
Bit Image Mode, Quadruple Density
Bold Print
Hex Decimal Series
Bold Print Reset
Cancel
Carriage Return
First character position
Character Pitch 10 CPI
Character Pitch 12 CPI
Character Set Select
Extended Character Set Select z 030 131 232 333
Is Multinational DP
Character Set Select 80-9F = Control Codes
Character Set Select 80-9F = Printable Symbols
Hex Decimal Series Serial
1242 1343 1444 1545
Character Set Select International Languages
131 French
Ual character set charts in Appendix B
Character Set Select ECMA-94 Latin 1 Extended
Serial Purpose
Condensed Print
Condensed Print Reset
Delete
Download a Language
ESC
224
225
Matically reset
Elongated Double High Print 1 Line
Emphasized Print
Emphasized Print Reset
Expanded Double Wide Print
Expanded Double Wide Print One Line Only
Extended Character Set
Extended Character Set Cancel Primary Character Set Select
Form Feed
Forms Length Set Inches
Forms Length Set Lines
Horizontal Tab
Horizontal Tab Set
Line space setting
Line Feed
Only print attributes are canceled
Line Feed n/216 Inch One Line Only
Line Spacing 1/6 Inch
Display when the 6/8 LPI switch is pressed
Line Spacing 1/8 Inch 8 lpi
Line Spacing 8 or 10.3 lpi One Line Only
Bility
Line Spacing 7/72 Inch
Line Spacing n/72 Inch
By the preceding SFCC/ESC a sequence
Line Spacing n/216 Inch
Overscoring
Plot, Even Dot P-Series High Density Graphics
Plot, Odd Dot P-Series Normal Density Graphics
Sfcc @
Print Mode/Pitch Selection
Where Sfcc PMODEn
Where Sfcc X mn and ESC X mn
Character Pitches Available by Print Mode
Print
Mode
Hex Characters per inch 030 131
Print Mode/Pitch Selection MVP
Expression Series
Serial Matrix
Print Mode/Pitch Codes
Printer Select
Printer Deselect
This feature is disabled whenever vertical tabs are set
Skip-Over Perforation
Skip-Over Perforation Cancel
Character column using the Backspace BS control code
Superscript/Subscript Printing
Superscript/Subscript Printing Reset
ESC T
Underline
VFU Commands P-Series
Vertical Tab
Vertical Tab Set/Clear Serial Matrix
Programming
Dataproducts Parallel Interface
Dataproducts Interface Signals
Chapter Interfaces
Dataproducts Parallel Interface Configuration
Signal Pin
Centronics Interface Signals
Centronics Parallel Interface
Centronics Parallel Interface Configuration
Centronics Interface Connector Pin Assignments
Remove Printer Cabinet Pedestal Model
Remove Paper Guide Assembly Floor Cabinet Model
Alternate Terminating Resistors
Printer Cabinet Removal Pedestal Model
Paper Guide Assembly Removal Floor Cabinet Model
Remove Controller Board and Install Terminating Resistors
Controller Board Access Pedestal and Floor Cabinet Models
Restore Printer to Operation Pedestal Model
Restore Printer to Operation Floor Cabinet Model
RS-232 Interface Signals
RS-232 Serial Interface
RS-232 Serial Interface Protocols
Serial Interface Pin Assignments
RS-232 Serial Interface Configuration
Chapter Routine Service & Diagnostics
General Cleaning
Exterior Cleaning
Interior Cleaning
Vorsicht
Interior Cleaning
Printer Self-Tests
Running the Self-Tests
Fault Messages
Hex Code Printout
Paper out
Selecting Extended Character Set Ecma
Chapter Multinational Character Sets
Selecting the Character Set and Language
OCR-A and OCR-B
Downloading Languages
Multinational Character Set Structure
Character Sets
Character Address Table Character Library
≡ Â IJ
Hex Value Decimal Value Symbol Name
Numeric Character Location Listing
Hex Value
Hex Value Decimal Value
Decimal Value
Hex Value Decimal Value Symbol Name
Hex Value Decimal Value
Hex Value
Decimal Value Symbol Name
Alphabetical Character Location Listing
Graphics Bar Double Left to Center Double Center to Bottom
Hex Value Decimal Value
Hex Value Decimal Value Symbol Name
Hex Value Decimal Value Symbol Name
Uppercase a with Acute Accent Mark
Hex Value Decimal Value Symbol Name
Hex Value
Multinational Character Sets
Chapter Installation
Power Requirements
Site Requirements
Pedestal Model Site Requirements
Shipping Restraints
Shipping Restraint Removal
Shipping Restraint Removal
Cable Connections
Cable Connections Pedestal Models
Cable Connections Floor Cabinet Models
Preliminary Test
Appendix a Standard Ascii Character Chart
KEY
Appendix
IBM PC Character Set Charts
Appendix B Character Sets
ETX
IBM PC Extended Set Series Emulation 80-9F=Control Codes
Bits
IBM PC Extended Set Series Emulation 80-9F=Printable Symbols
DEL
206 226 246 266 306 326 346 366
100 116 105 125 145 165 101 117 106 126 146 166
KEY
005B 005C 005D 005E 005F 0060 007B 007C 007D 007E
IBM PC International Languages Substitution Table
Hex Address
Multinational Character Set Charts
Bits
NUL
Bits
KEY
177 111 127
SOH
103 123 143 163 115
Decimal
Multinational Primary Character Set in OCR-A
Multinational Extended Character Set in OCR-A
Multinational Primary Character Set in OCR-B
Multinational Extended Character Set in OCR-B
Multinational International Languages Substitution Table
Hex Address 005B 005D 005E
ECMA-94 Latin 1 Character Set Charts
Bits
KEY
Bits
ESC
DEL
ETX
103 123 143 163 115
Decimal
ECMA-94 Latin 1 International Languages Substitution Table
Hex Address 007B 007C 007D 007E
0024
005C 005D 005E
DEC Multinational Character Set Charts
Bits
KEY
Bits
ESC
DEL
NUL
103 123 143 163 115
KEY
005C 005D 005E 005F
007C 007D 007E
Appendix C Specifications
Printing Characteristics
Physical Characteristics
Environmental Characteristics
Electrical Characteristics
Interfaces
Forms
Miscellaneous
Cleaning
Character Sets
ECMA-94 Latin
Multinational DEC Multinational
Appendix
Function Series Serial
Appendix D Control Code Cross Reference
Alphabetical By Function
Sfcc W DC4 ESC W
Alphabetical By P-Series Code
Series Code Function
Alphabetical By Serial Matrix Code
Serial Code Function
Line Spacing n/72 Inch as set by ESC a
Appendix
Index
IBM PC, B-1
Evfu
INCHES, Sfcc
Page
See also Control Panel or the switch by name
Index-6 P3000 Series Multinational User’s Reference Manual
Page
Printronix