Nexus 1250 /1252
Electro Industries/GaugeTech Doc # E107706
Nexus 1250/1252 Revision
Limitation of Warranty
Customer Service and Support
Product Warranty
Statement of Calibration
Futura+ Series Products
About Electro Industries/GaugeTech
Applications
DM Series Products
Electro Industries/GaugeTech Doc # E107706
Table of Contents
Transformer Loss Compensation
Communication Wiring
Using the Nexus External Displays
Nexus Time-of-Use
Nexus Monitor with Internal Network Option
Nexus External I/O Modules
Nexus Monitor with INP2 Internal Modem Option
Flicker
Glossary of Terms
Chapter Three-Phase Power Measurement
Three-Phase System Configurations
Wye Connection
Phase-to-Ground Voltage Phase-to-Phase Voltage
Three-Phase Delta Winding Relationship
Delta Connection
Blondell’s Theorem and Three Phase Measurement
Phase B Phase C Node n Phase a
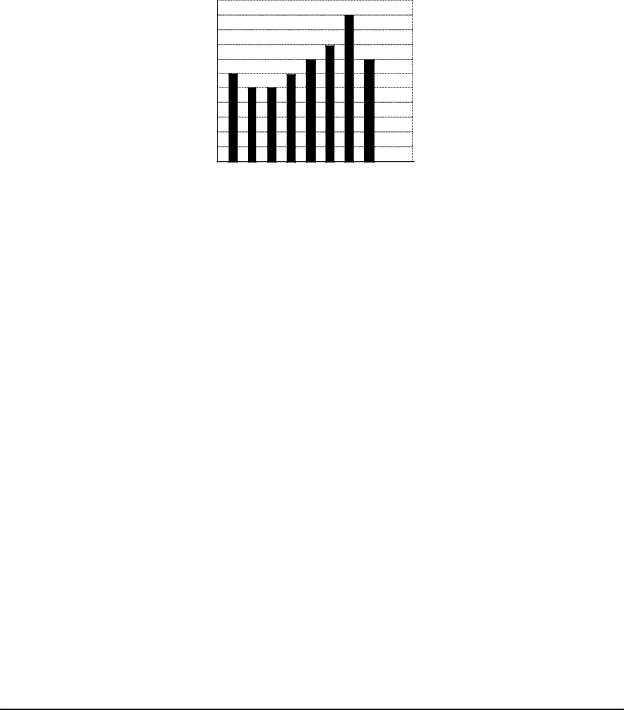
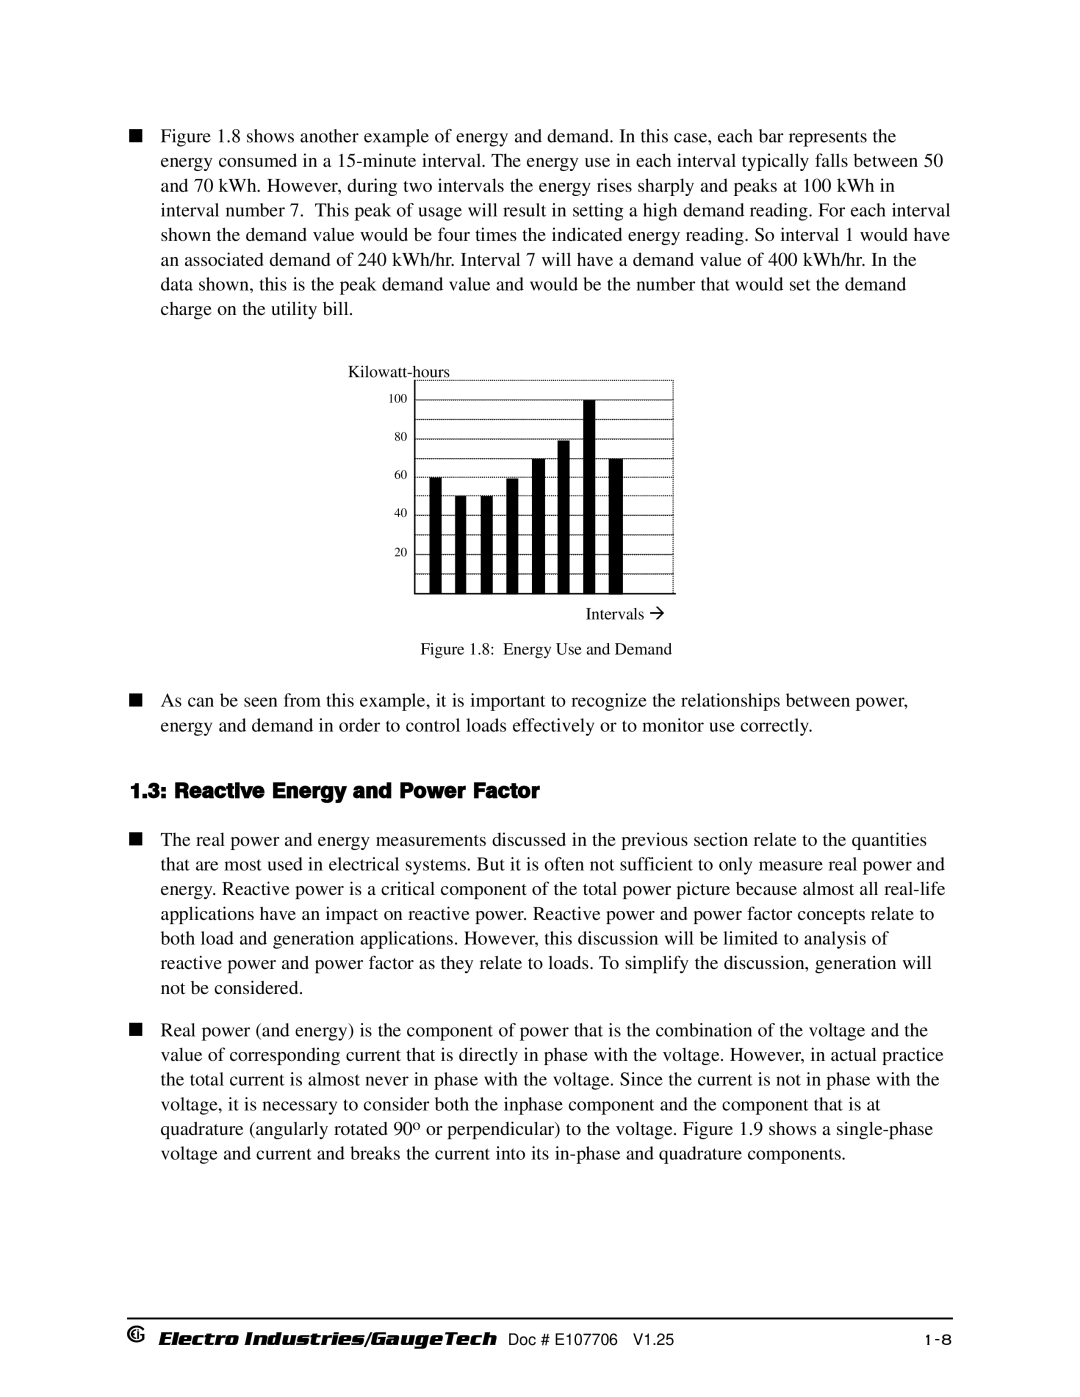
Power, Energy and Demand
Power Use Over Time
Time Interval Power kW Energy kWh Accumulated Minute
Reactive Energy and Power Factor
Energy Use and Demand
Voltage and Complex
Harmonic Distortion
10 Nondistorted Current Waveform
11 Distorted Current Wave
Electro Industries/GaugeTech Doc # E107706
Power Quality
Cause Disturbance Type Source
Electro Industries/GaugeTech Doc # E107706
Chapter Nexus Overview
Nexus System
Flicker
Nexus 1250/1252 Power Quality Monitoring
DNP V3.00 Level 1 and Level
Nexus 1250/1252 Revenue Metering
Dial-In Function
Dial-Out Function
Total Web Solutions
Hardware Connection
Enter the Domain Name Server and Computer Name
Measurements and Calculations
Root Mean Square RMS of Currents n = number of samples
Reactive Power VAR per phase
Power Watts per phase
Apparent Power VA per phase
Power Watts Total
Reactive Power VAR Total
Apparent Power VA Total
Power Factor PF
Watt hour Wh
Phase Angles
Total Harmonic Distortion %THD
VAR hour VARh
Demand Integrators
Partial = ∑Value
Other I/O Accessories
Nexus External I/O Modules Optional
Nexus 1250/1252 Meter Specifications
Specification Nexus Meter
Nexus P40N, P41N, P43N LED External Display Specifications
Nexus P60N Touch Screen Display Specifications
Chapter Hardware Installation
Mounting the Nexus 1250/1252 Meter
Nexus Meter Mounting Diagram, Side View
Nexus P40N LED External Display Mounting Diagrams
Mounting the Nexus LED External Displays
Mounting the Nexus P60N Touch Screen External Display
Connect to Nexus
Cutout for Nexus P60N Touch Screen Display
Mounting the Nexus External I/O Modules
Nexus I/O Module Communication Ports
Nexus I/O Modules Mounting Diagram, Front View
Electro Industries/GaugeTech Doc # E107706
Chapter Electrical Installation
Instrument Power Connections
Isolating a CT Connection Reversal
Wiring Diagrams
Figure # Description
25 a
25A
4-Wire Wye, 3-Element with 3 PTs and 3 CTs
3-Wire, 2-Element Open Delta with 2 PTs and 3 CTs
3-Wire, 2-Element Open Delta with 2 PTs, 2 CTs
3-Wire, 2-Element Delta Direct Voltage with 3 CTs
3-Phase, 4-Wire Wye, 2.5 Element with 2 PTs, 3 CTs
4-Wire, 3-Element Grounded Delta with 4 CTs G Option
Electro Industries/GaugeTech Doc # E107706
Chapter Communication Wiring
Communication Overview
RJ-11 Communication with Internal Modem Option
MODBUS/TCP
IRIG-B
Nexus RS-485 Wiring Fundamentals with RT Explanation
RS-232 Connection-Nexus Meter to a Computer
Wire RS-485 Port
For All RS-485 Connections
Incorrect Connection T
Incorrect Connection Star
RS-485 Connection-Nexus Meter to a Computer or PLC
Using the Unicom
Unicom 2500 with Connections
Nexus Meter Port
Nexus Meter Port
Communication Ports on the Nexus I/O Modules
12 Communication Ports on the Nexus I/O Modules
11 RS-485 Connection-Nexus Meter to Nexus I/O Modules
13 Nexus Meter Connected to Nexus I/O Module
Steps to Determine Power Needed
13 I/O Modules’ Factory Settings and VA Ratings
Linking Multiple Nexus Devices in Series
14 Linking Multiple Nexus Devices in Series
Networking Groups of Nexus Meters
15 Networking Groups of Nexus Meters
Remote Connection-RS-232
RS-485 wiring with a Modem Manager. See section
Remote Communication Overview
Remote Connection-RS-485
17 Remote Connections with Internal Modem Option
RJ-45MODBUS/TCP over Ethernet
Remote Communication-RS-232
Remote Communication-RS-485
Programming Modems for Remote Communication
Modem String/Setting
Selected Modem Strings
High Speed Inputs Connection
Five Modes of Time Synchronization
Installation
IRIG-B Connections
Electro Industries/GaugeTech Doc # E107706
Mode Button
LED Display Up/Down Arrows
Connect Multiple Displays
Nexus P40N Modes
P41N
Dynamic Readings Mode
Electro Industries/GaugeTech Doc # E107706
Navigational Map of Dynamic Readings Mode
Nexus Information Mode
Group 1 Device Time
Group 4 External Display Units
Navigational Map of Nexus Information Mode
Readings
Group 2 Reset Energy
Display Features Mode
Group 1 Reset Max/Min
Group 8 Display Scroll ON/OFF
Navigational Map of Display Features Mode
General Groups of Readings Reset Button View Limits
Nexus P60N Touch Screen External Display
General page Overview of Real Time Readings
Volts Voltage Readings PH-PH
Volts Voltage Readings Details
Volts Voltage Readings PH-N
Amps Current Readings Details
Amps Current Readings A-B-C
Real Time Power Real Time Power Readings Details
Demand Power Demand Power Readings Details
Energy Accumulated Energy Information
TOU Accumulations
TOU Register Demand
Touch Short Term or Long Term to view other Flicker screens
Limits Limit Status
Phasors Phasor Analysis
Waveform Real Time Graph
Real Time Trending Channel Selector
Reset Meter Reset Commands
LOG Status Logging Statistics
Nexus Port Settings
Navigational Map for P60N Touch Screen External Display
Chapter Transformer Loss Compensation
Introduction
Electro Industries/GaugeTech Doc # E107706
Nexus 1250/1252 Transformer Loss Compensation
Loss Compensation in Three Element Installations
Three Element Loss Compensation Worksheet
Transformer Data from Transformer Manufacturer’s Test Sheet
Meter/Installation Data
Base Conversion Factors
Load Loss at Transformer
Normalize Losses to Meter Base
Loss Watts Percentage Values
Calculate Load Loss Values
Chapter Nexus Time-of-Use
Nexus TOU Calendar
TOU Prior Season and Month
Updating, Retrieving and Replacing TOU Calendars
Daylight Savings and Demand
Chapter Nexus External I/O Modules
I/O Module Components
Port Overview
Installing Nexus External I/O Modules
Nexus Meter Connected to I/O Module
Power Source for I/O Modules
Psio Power Source Side View Showing Male RS-485 Side Port
Using Psio with Multiple I/O Modules
Steps for Attaching Multiple I/O Modules
Factory Settings and Reset Button
Factory Settings
Analog Transducer Signal Output Modules
Overview
Normal Mode
Analog Input Modules
Normal Mode
Digital Dry Contact Relay Output Form C Module
Communication
Digital Solid State Pulse Output KYZ Module
Communication
Digital Status Input Module
Specifications
Chapter Nexus Monitor with Internal Modem Option
Nexus with Internal Modem Option
10-2
Chapter Nexus Meter with Internal Network Option
11-1
11-2
11-3
11-4
Chapter Flicker
Theory of Operation
Long Term Flicker Evaluation
Instantaneous Flicker Evaluation
Short Term Flicker Evaluation
Summary
Setup
Measurement Procedure
Data available
Software User Interface
Main screen
Frequency
Time
Status
Flicker Monitoring
Long Term Readings
Short Term Readings
Pst Readings Displayed
Plt Readings Displayed
Logging
Polling
Log Viewer
Performance Notes
Calculating Values
Excel Spreadsheet with Example Numbers
Electro Industries/GaugeTech Doc # E107706
Electro Industries/GaugeTech Doc # E107706
Electro Industries/GaugeTech Doc # E107706
Electro Industries/GaugeTech Doc # E107706
Electro Industries/GaugeTech Doc # E107706
Glossary
Electro Industries/Gauge Tech Doc # E107706
Glossary-2
Glossary-3
Glossary-4
Glossary-5
Glossary-6