5020A
Limited Warranty and Limitation of Liability
Table of Contents
5020A
Index
5020A
List of Tables
5020A
List of Figures
Viii
Introduction and Specifications
5020A
Introduction
Safety Information
Symbols Used
Safety Information
Technical Support
Specifications
AC Adapter
Environmental Conditions
5020A
5026A-H/S
Quick Start
5020A
Use Proper Care
Learn About the Features and Components
Install the Battery
Unpacking
Measure Temperature
Connect the Power Source
Switch the Power On
Parts and Controls
5020A
Front Panel
Front Panel
Right Side Panel
Top Panel
Back Panel
Left Side Panel
Quick Buttons
Configurations
Accessories
Accessories
5020A
General Operation
5020A
Battery
DC Power Source
Alarm Screen
Sensor Configuration
Power Switch
Power On Self-Test
Sensors
Unit of Temperature
Recording Measurements
5020A
Menu Functions
Comm Setting Serial Password System Info
Main Display
Channel Menu
Channel Menu
Channel Setting
Sensor ID
Channel Setting
Sensor Cal
Sensor Lock
Sensor Channel Select
Display Menu
Display Menu
Display Setting
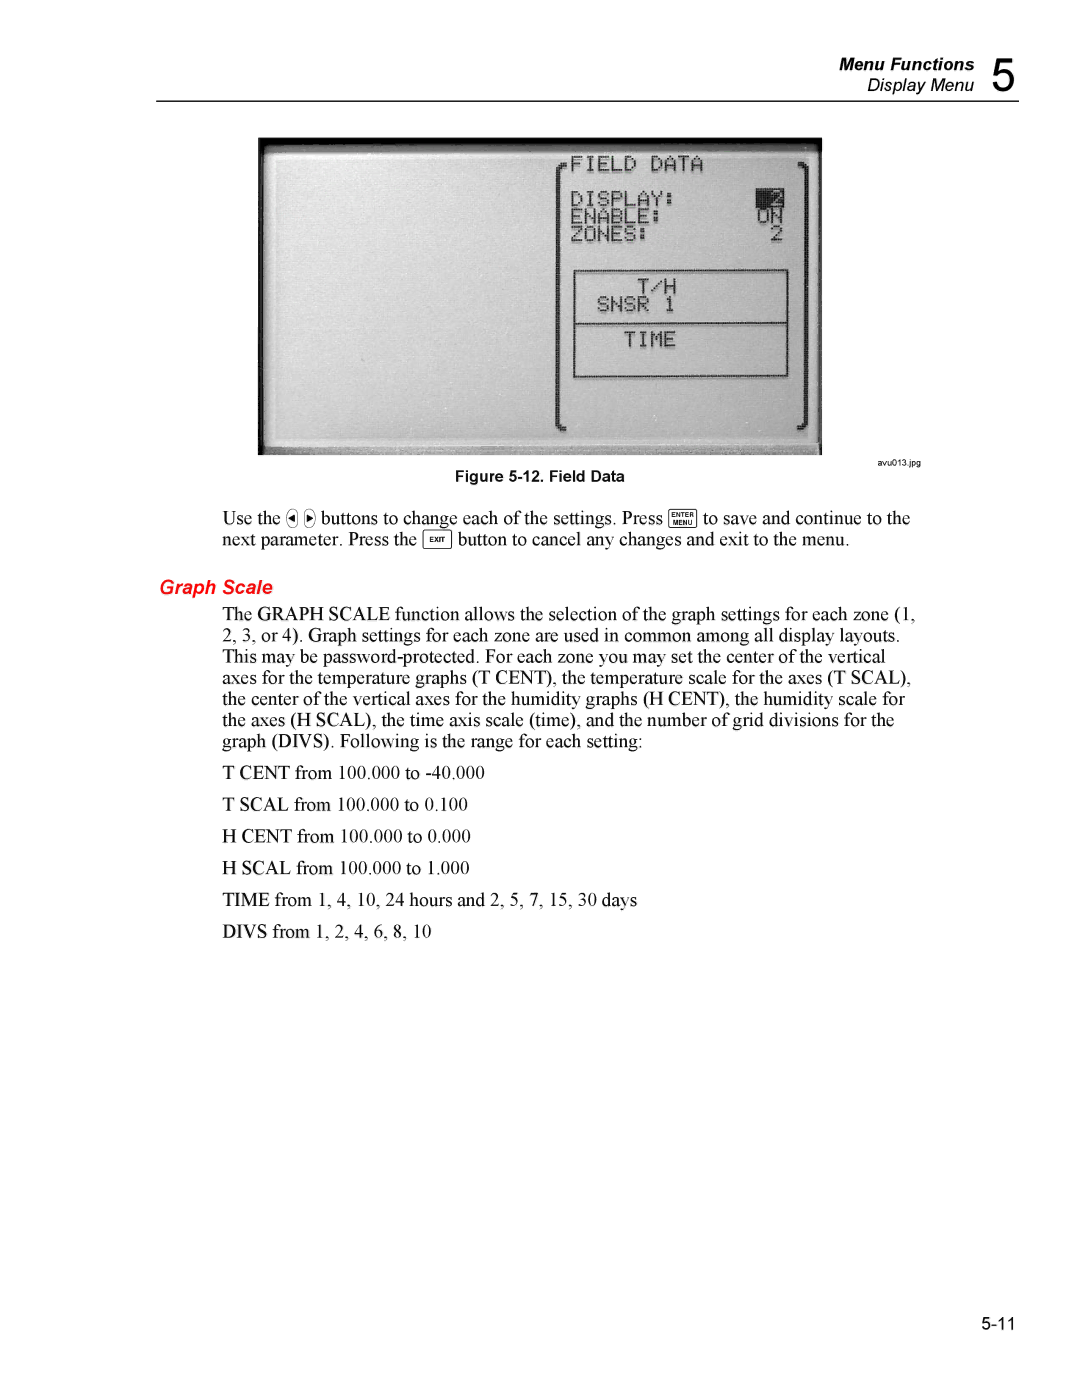
Field Data
Display Layout
Field Types
12. Field Data
Graph Scale
13. Graph Scale, Select Zone
Display Reset
Data Card
Data Menu
Data Record
Record Setting
Data View
18. Record Setting
19. Data View, Begin Time
Data Storage
Data Print
Daily Stats
Data Clear
24. Daily Stats
Stats Setting
Stats Print
Stats View
Stats Clear
Stats Reset
File Write
Data Card
31. File Write
File View
32. File View
Alarm Menu
33. Alarm
Alarm Setting
System Alarm
Sensor Alarm
System Menu
Alarm View
38. System Menu
System Setting
40. Data Time
Date Time
Comm Setting
Print
Serial
43. IR
Password
Keep your password in a secure location
45. System Info
System Info
Digital Communications Interface
5020A
Communications
Serial Wiring
Command Syntax
Interface Commands
Command Summary
Interface Commands
Page
Enables or disables the high temperature alarm for
Page
Digital Communications Interface
Page
Enables or disables the date/time password protection
Commands
ALARmBATTeryENABle bool
Alarm Commands
ALARmBATTery?
ALARmBATTeryENABle?
ALARmDATELAST?
ALARmBEEP bool
ALARmCLEar
ALARmDATEFIRSt?
ALARmRHUMiditychnLOWerENABle?
ALARmPOWerENABle?
ALARmPOWerENABle bool
ALARmRHUMiditychnLOWer?
ALARmRHUMiditychnRATEENABle bool
ALARmRHUMiditychnLOWerLIMit floatMINMAXDEF
ALARmRHUMiditychnRATE?
ALARmRHUMiditychnRATEENABle?
ALARmRHUMiditychnSENSorENABle bool
ALARmRHUMiditychnRATELIMit floatMINMAXDEF
ALARmRHUMiditychnSENSor?
ALARmRHUMiditychnSENSorENABle?
ALARmTEMPuraturechnLOWer?
ALARmRHUMiditychnUPPerENABle bool
ALARmRHUMiditychnUPPerLIMit? Minmaxdef
ALARmRHUMiditychnUPPerLIMit floatMINMAXDEF
ALARmTEMPuraturechnRATEENABle?
ALARmTEMPuraturechnLOWerLIMit? Minmaxdef
ALARmTEMPuraturechnLOWerLIMit floatMINMAXDEF
ALARmTEMPuraturechnRATE?
ALARmTEMPuraturechnSENSorENABle?
ALARmTEMPuraturechnRATELIMit? Minmaxdef
ALARmTEMPuraturechnRATELIMit floatMINMAXDEF
ALARmTEMPuraturechnSENSor?
ALARmTEMPuraturechnUPPerLIMit floatMINMAXDEF
ALARmTEMPuraturechnUPPerENABle?
ALARmTEMPuraturechnUPPerENABle bool
ALARmTEMPuraturechnUPPerLIMit? Minmaxdef
Measurement Commands
CALCulatechnPARameternumRATE?
CALCulatechnPARameternumRESolution? Minmaxdef
CALCulatechnPARameternumAVERagetypeDATA?
CALCulatechnPARameternumAVERagetypeTYPE?
FETCh? chn
CALCulatechnPARameternumRESolution numMINMAXDEF
READ? chn
FORMatTDSTSTATe?
FORMatTDSTSTATe bool
MEASure? chn
Data Commands
DATaDSTatisticsRECordCLEar
DATaDSTatisticsRHOur? Minmaxdef
DATaDSTatisticsRHOur numMINMAXDEF
DATaDSTatisticsRECordBTIMe? num
DATaRECordCLEar
DATaDSTatisticsRECordETIMe? num
DATaDSTatisticsRECordFIND? year,month,day
DATaDSTatisticsRECordVALue? num,chn,type
DATaRECordOPEN?
DATaRECordFEEDTEMPeraturechn?
DATaRECordFEEDTEMPeraturenum bool
DATaRECordFREE?
Measurement Control Commands
SENSorchnIDENtification?
SENSorAVERage bool
SENSorchnLOCK?
SENSorchnLOCK bool
SENSorchnSTATe?
TRIGgerTIMer? Minmaxdef
TRIGgerTIMer numMINMAXDEF
Channel Commands
Calibration Commands
CALibratechnEXPired?
CALibratechnDATECALibrate year,month,day
CALibratechnDATEDUE?
CALibratechnDATEDUE year,month,day
CALibratechnPARameterSCALenum float
System Commands
CALibratechnPARameterOFFSetnum float
CALibratechnPARameterSCALenum?
SYSTemCODEVERSion?
SYSTemBOOTVERSion?
SYSTemERRor?
UNITTEMPerature?
Communication Interface Commands
SYSTemCOMMunicateSERialLINefeed?
SYSTemCOMMunicateSERialFDUPlex bool
SYSTemCOMMunicateSERialFEED?
SYSTemCOMMunicateSERialFEED bool
Date and Time Commands
SYSTemDECimalFORMat numMINMAXDEF
SYSTemDATEFORMat? Minmaxdef
SYSTemDATEFORMat numMINMAXDEF
SYSTemDECimalFORMat? Minmaxdef
SYSTemTIMEFORMat? Minmaxdef
Password Commands
SYSTemTIMEDAYLight? Minmaxdef
SYSTemTIMEDAYLight numMINMAXDEF
SYSTemPASSwordCENable pass
SYSTemPASSwordALARm?
SYSTemPASSwordALARm bool
SYSTemPASSwordCDISable
SYSTemPASSwordSENSor bool
SYSTemPASSwordRECord?
SYSTemPASSwordRECord bool
SYSTemPASSwordSENSor?
ESE numMINMAXDEF
SYSTemPASSwordTIME?
SYSTemPASSwordTIME bool
Status Commands
SRE numMINMAXDEF
ESR?
TST? bool
STB?
Digital Communications Interface
STATusALARmCONDition?
STATusALARm?
STATusMEASureCONDition?
STATusALARmENABle?
STATusALARmENABle numMINMAXDEF
STATusMEASure?
STATusOPERationCONDition?
STATusMEASureENABle?
STATusMEASureENABle numMINMAXDEF
STATusOPERation?
STATusQUEStionable?
STATusOPERationENABle?
STATusOPERationENABle numMINMAXDEF
Port Numbers
STATusQUEStionableENABle?
STATusQUEStionableENABle numMINMAXDEF
STATusQUEStionableCONDition?
Date and Time Formats
5020A
Calibration Procedure
5020A
Calibration Points
Equipment
Preparation
Temperature and Humidity Adjustments
Temperature and Humidity Measurement Errors
∆ TSL = −10C ⋅ TerrorT 3 − TerrorT1
5020A
Maintenance and Troubleshooting
5020A
Missing or Scattered Graph Data
Maintenance
Troubleshooting
Incorrect temperature or humidity reading
Blank screen
Error message at power up
Self-Test Error Messages
Downloading Recorded Data
Placement of IR Dongle for Transfer of Data
Start-up Error Messages
EMC Directive
Frequently Asked Questions
Low Voltage Directive Safety
CE Comments
Frequently Asked Questions
5020A
Index
5020A
Zone types
5020A