|
|
|
|
|
|
|
|
|
|
| B e n c h S e t u p |
| 3 - 1 5 | |
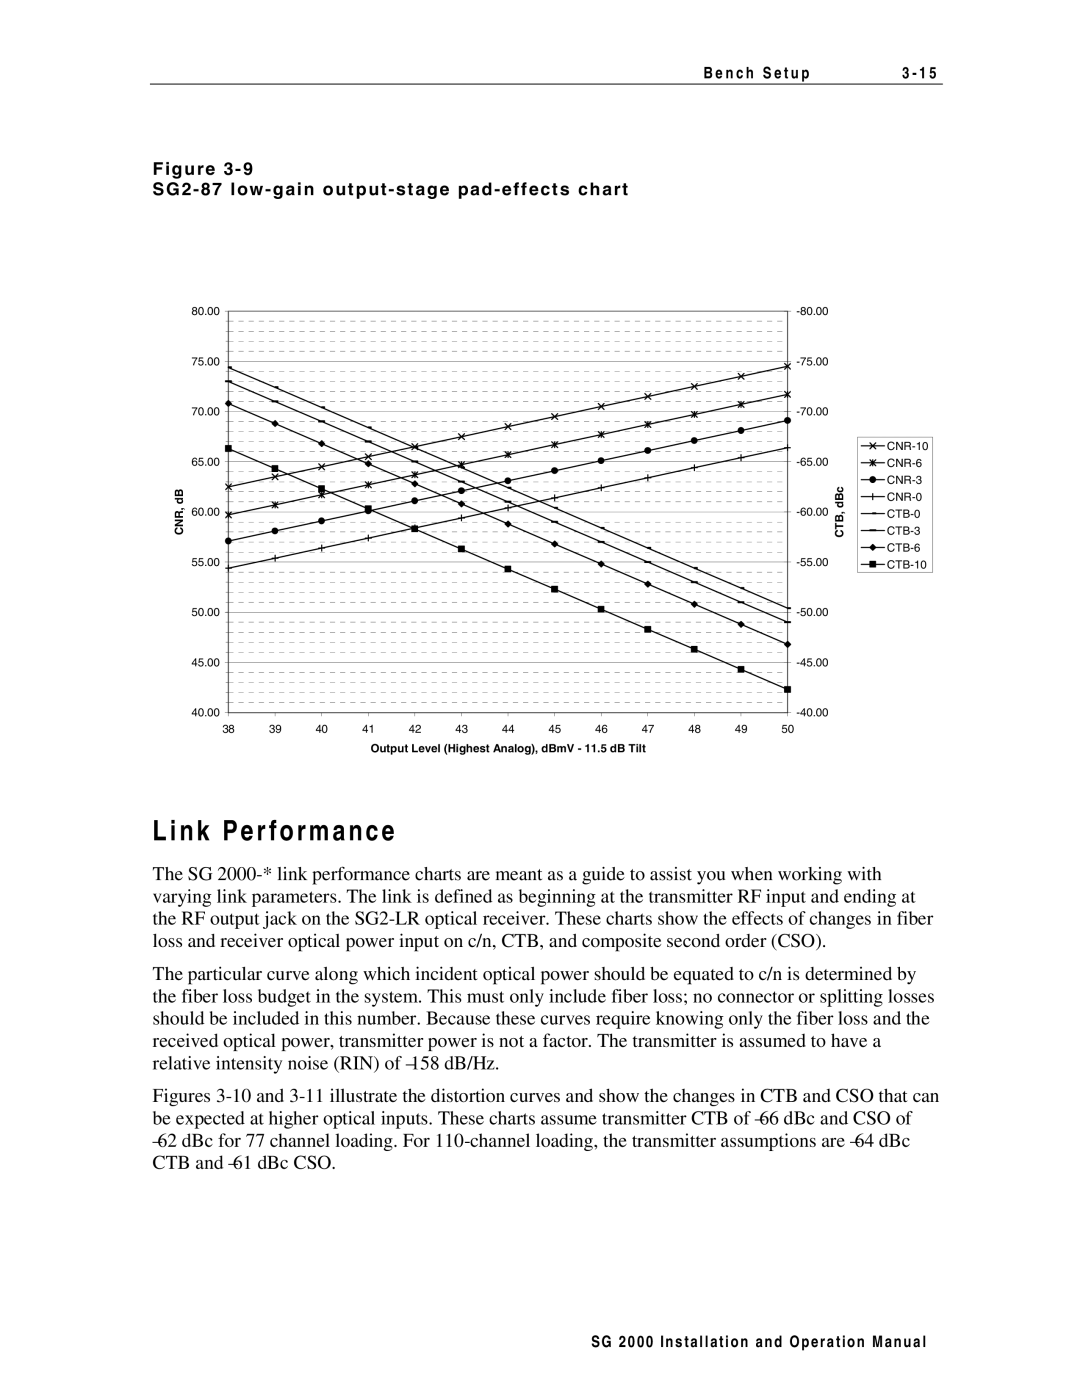
F i g u r e 3 - 9 |
|
|
|
|
|
|
|
|
|
|
|
|
|
|
S G 2 - 8 7 l o w - g a i n o u t p u t - s t a g e p a d - e f f e c t s c h a r t |
|
|
|
|
|
| ||||||||
80.00 |
|
|
|
|
|
|
|
|
|
|
|
|
| |
75.00 |
|
|
|
|
|
|
|
|
|
|
|
|
| |
70.00 |
|
|
|
|
|
|
|
|
|
|
|
|
| |
|
|
|
|
|
|
|
|
|
|
|
|
|
| |
65.00 |
|
|
|
|
|
|
|
|
|
|
|
| ||
CNR,dB |
|
|
|
|
|
|
|
|
|
|
|
| CTB,dBc | |
|
|
|
|
|
|
|
|
|
|
|
| |||
|
|
|
|
|
|
|
|
|
|
|
|
|
| |
60.00 |
|
|
|
|
|
|
|
|
|
|
|
| ||
|
|
|
|
|
|
|
|
|
|
|
|
|
| |
55.00 |
|
|
|
|
|
|
|
|
|
|
|
| ||
50.00 |
|
|
|
|
|
|
|
|
|
|
|
|
| |
45.00 |
|
|
|
|
|
|
|
|
|
|
|
|
| |
40.00 |
|
|
|
|
|
|
|
|
|
|
|
|
| |
38 | 39 | 40 | 41 | 42 | 43 | 44 | 45 | 46 | 47 | 48 | 49 | 50 |
|
|
|
|
| Output Level (Highest Analog), dBmV - 11.5 dB Tilt |
|
|
|
|
| ||||||
L i n k P e r f o r m a n c e
The SG
The particular curve along which incident optical power should be equated to c/n is determined by the fiber loss budget in the system. This must only include fiber loss; no connector or splitting losses should be included in this number. Because these curves require knowing only the fiber loss and the received optical power, transmitter power is not a factor. The transmitter is assumed to have a relative intensity noise (RIN) of
Figures 3-10 and 3-11 illustrate the distortion curves and show the changes in CTB and CSO that can be expected at higher optical inputs. These charts assume transmitter CTB of –66 dBc and CSO of –62 dBc for 77 channel loading. For 110-channel loading, the transmitter assumptions are –64 dBc CTB and –61 dBc CSO.
S G 2 0 0 0 I n s t a l l a t i o n a n d O p e r a t i o n M a n u a l
