Tonal Map
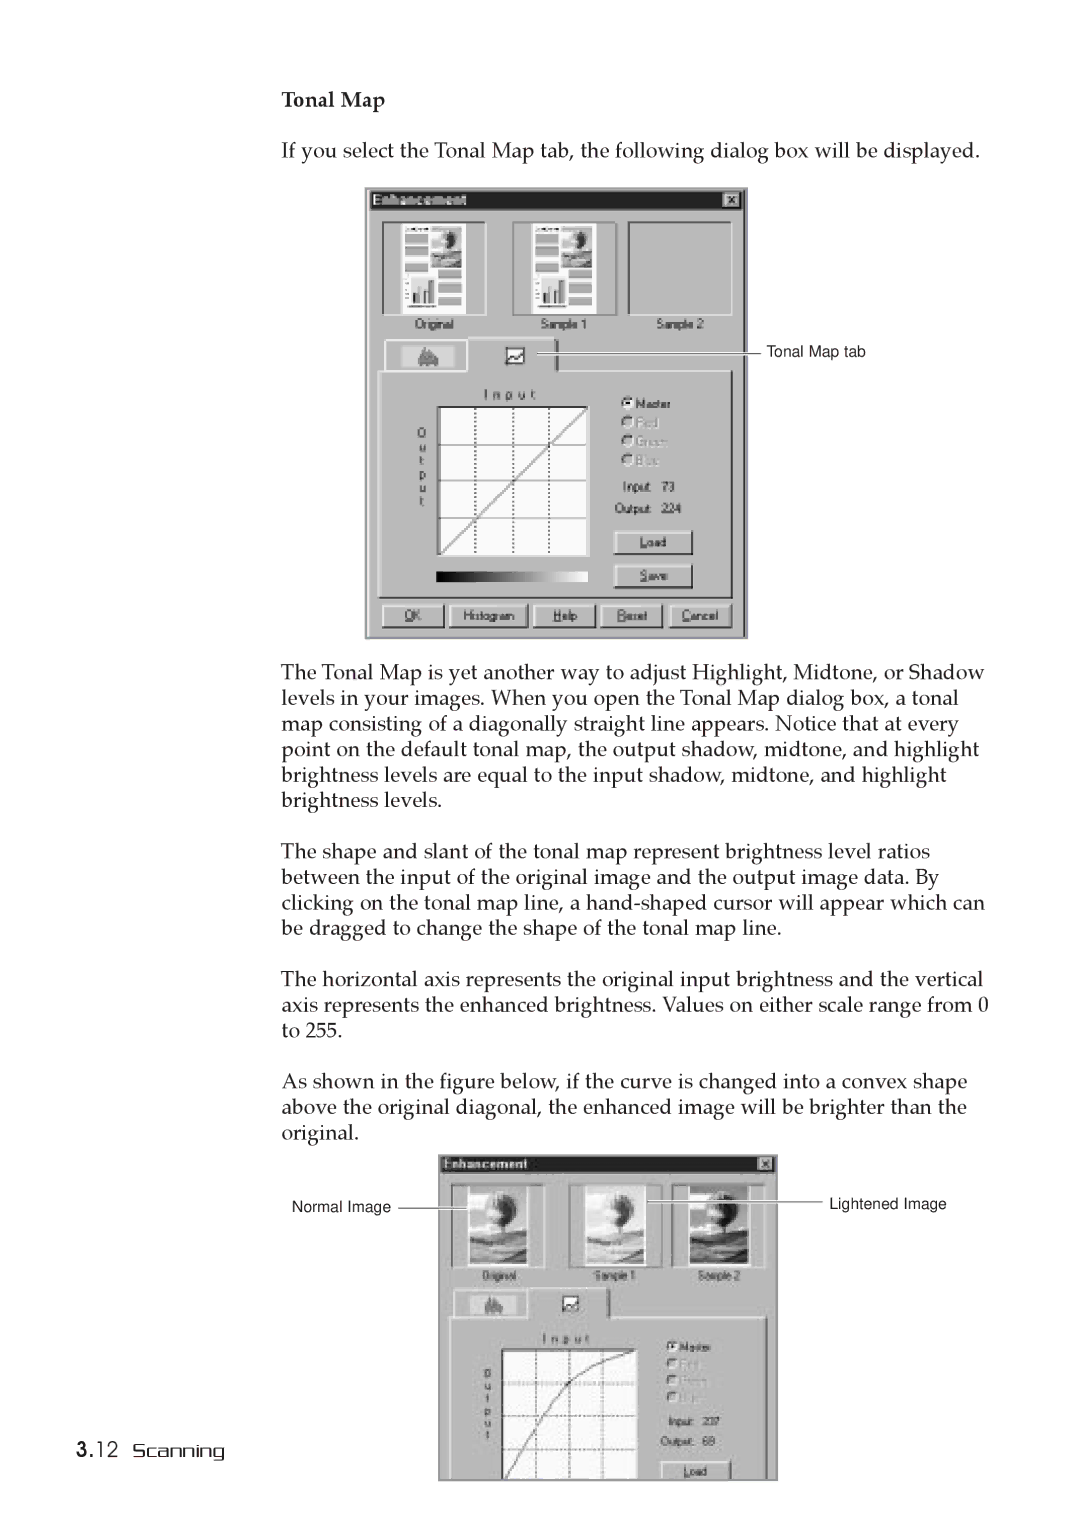
If you select the Tonal Map tab, the following dialog box will be displayed.
Tonal Map tab
The Tonal Map is yet another way to adjust Highlight, Midtone, or Shadow levels in your images. When you open the Tonal Map dialog box, a tonal map consisting of a diagonally straight line appears. Notice that at every point on the default tonal map, the output shadow, midtone, and highlight brightness levels are equal to the input shadow, midtone, and highlight brightness levels.
The shape and slant of the tonal map represent brightness level ratios between the input of the original image and the output image data. By clicking on the tonal map line, a
The horizontal axis represents the original input brightness and the vertical axis represents the enhanced brightness. Values on either scale range from 0 to 255.
As shown in the figure below, if the curve is changed into a convex shape above the original diagonal, the enhanced image will be brighter than the original.
Normal Image ![]()
Lightened Image
3.12 Scanning
