
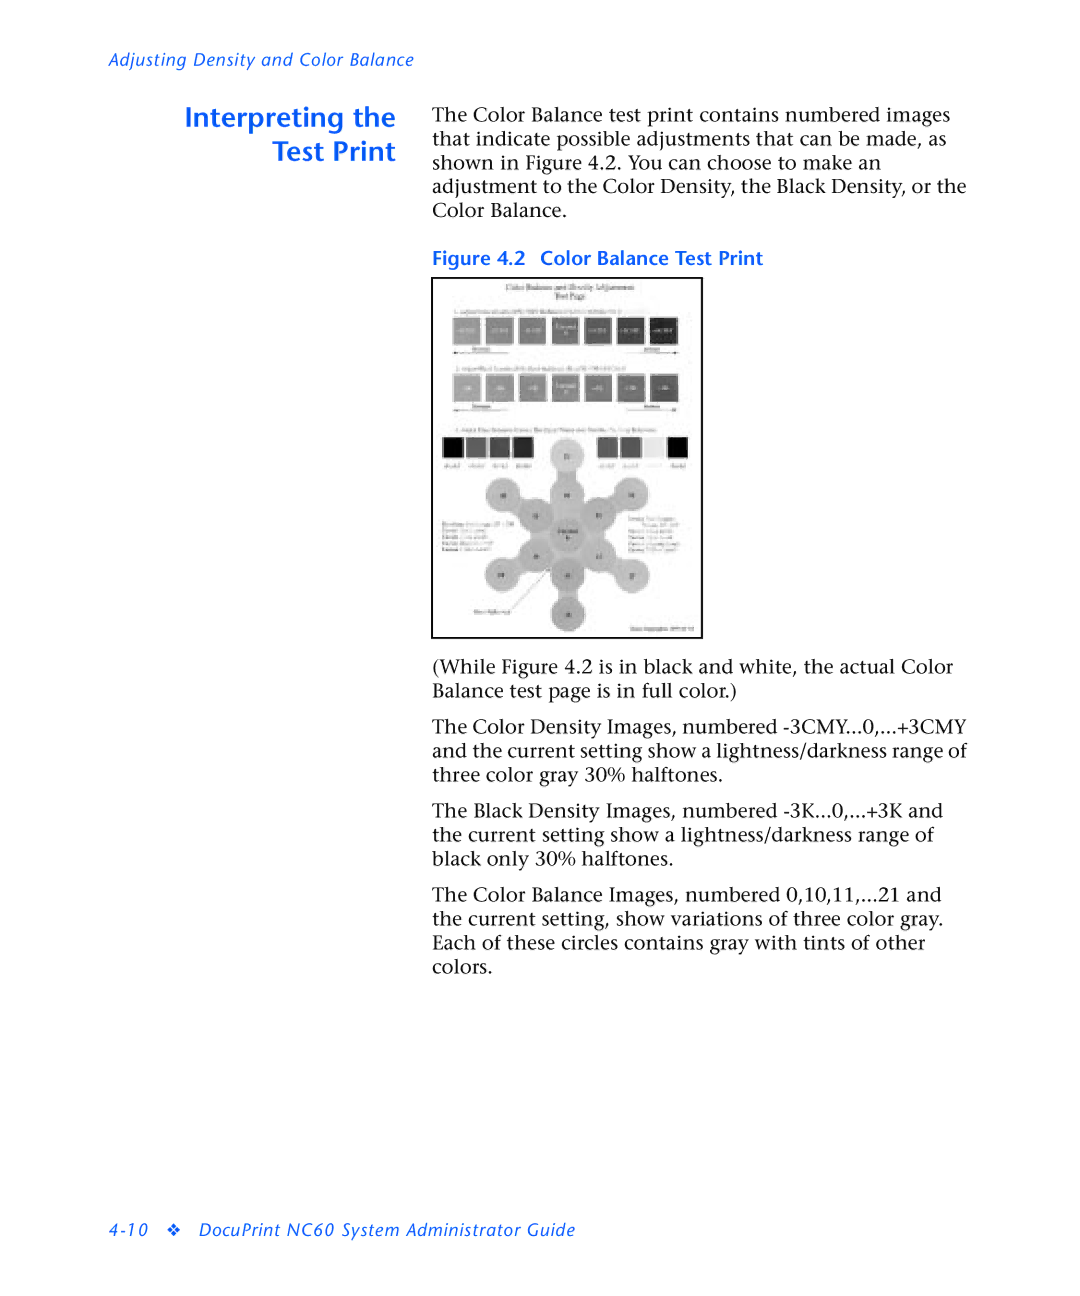
NC60 specifications
The 3D Innovations NC60 is a state-of-the-art 3D printer known for its precision, versatility, and user-friendly design. This machine has been widely adopted by professionals in various fields, including engineering, product development, and educational institutions. With its robust features and advanced technologies, the NC60 stands out in the competitive landscape of 3D printing.One of the main features of the NC60 is its high-resolution printing capability. The printer employs a unique layer resolution that can reach as fine as 50 microns, allowing for intricate designs and precise detail. This level of resolution is particularly beneficial for applications requiring tight tolerances, such as prototyping and manufacturing small components. Users can count on the NC60 to deliver smooth finishes and fine details that enhance the visual and functional quality of printed objects.
The NC60 utilizes a dual extruder system, which significantly expands its printing possibilities. This technology enables the simultaneous use of two different materials, allowing creators to experiment with complex multi-material designs. Users can print objects with varying densities, colors, and even incorporate support structures made from dissolvable materials, simplifying post-processing. This capability not only saves time but also enhances the overall design complexity that users can achieve.
Another notable characteristic of the NC60 is its versatility in material compatibility. The printer supports a wide range of filaments, including PLA, ABS, PETG, and even specialty composites like carbon fiber-infused polymers. This adaptability ensures that users have the freedom to select the best materials for their specific applications, whether they require strength, flexibility, or aesthetic appeal.
Additionally, the NC60 is equipped with an intuitive touchscreen interface that makes the printing process straightforward, even for beginners. Users can easily navigate through settings, upload designs, and monitor print progress. The printer’s automatic bed leveling and calibration features further enhance user experience by ensuring optimal printing conditions without requiring extensive technical knowledge.
In terms of design, the NC60 boasts a compact footprint, making it suitable for small workspaces. Its sturdy frame contributes to stability during operation, reducing vibrations that could affect print quality. The printer’s enclosure also offers a controlled environment for temperature-sensitive materials, enhancing print reliability.
In conclusion, the 3D Innovations NC60 is an impressive 3D printer combining high-resolution capabilities, dual extruder technology, and extensive material compatibility. With its user-friendly interface and compact design, the NC60 is an ideal choice for professionals and hobbyists alike, paving the way for innovative creations.