Token Ring Statistics
Using these radio buttons, you can choose whether to view the statistics gathered since the
To choose Total, Delta, or Cumulative:
•Click on the Total radio button. After the completion of the current polling cycle plus one complete polling cycle, the screen will display the sum of statistics processed since the
•Click on the Delta radio button. After the completion of the current polling cycle plus two more polling cycles, the screen will display the count of statistics processed during the last polling interval. These counts are refreshed after each polling cycle.
•Click on the Cumulative radio button. After the completion of the current polling cycle, the screen will display the count of statistics processed during the last polling interval, and then will accumulate statistics with each polling cycle thereafter until another display option is chosen.
Viewing Elapsed, Average, and Peak Activity Levels
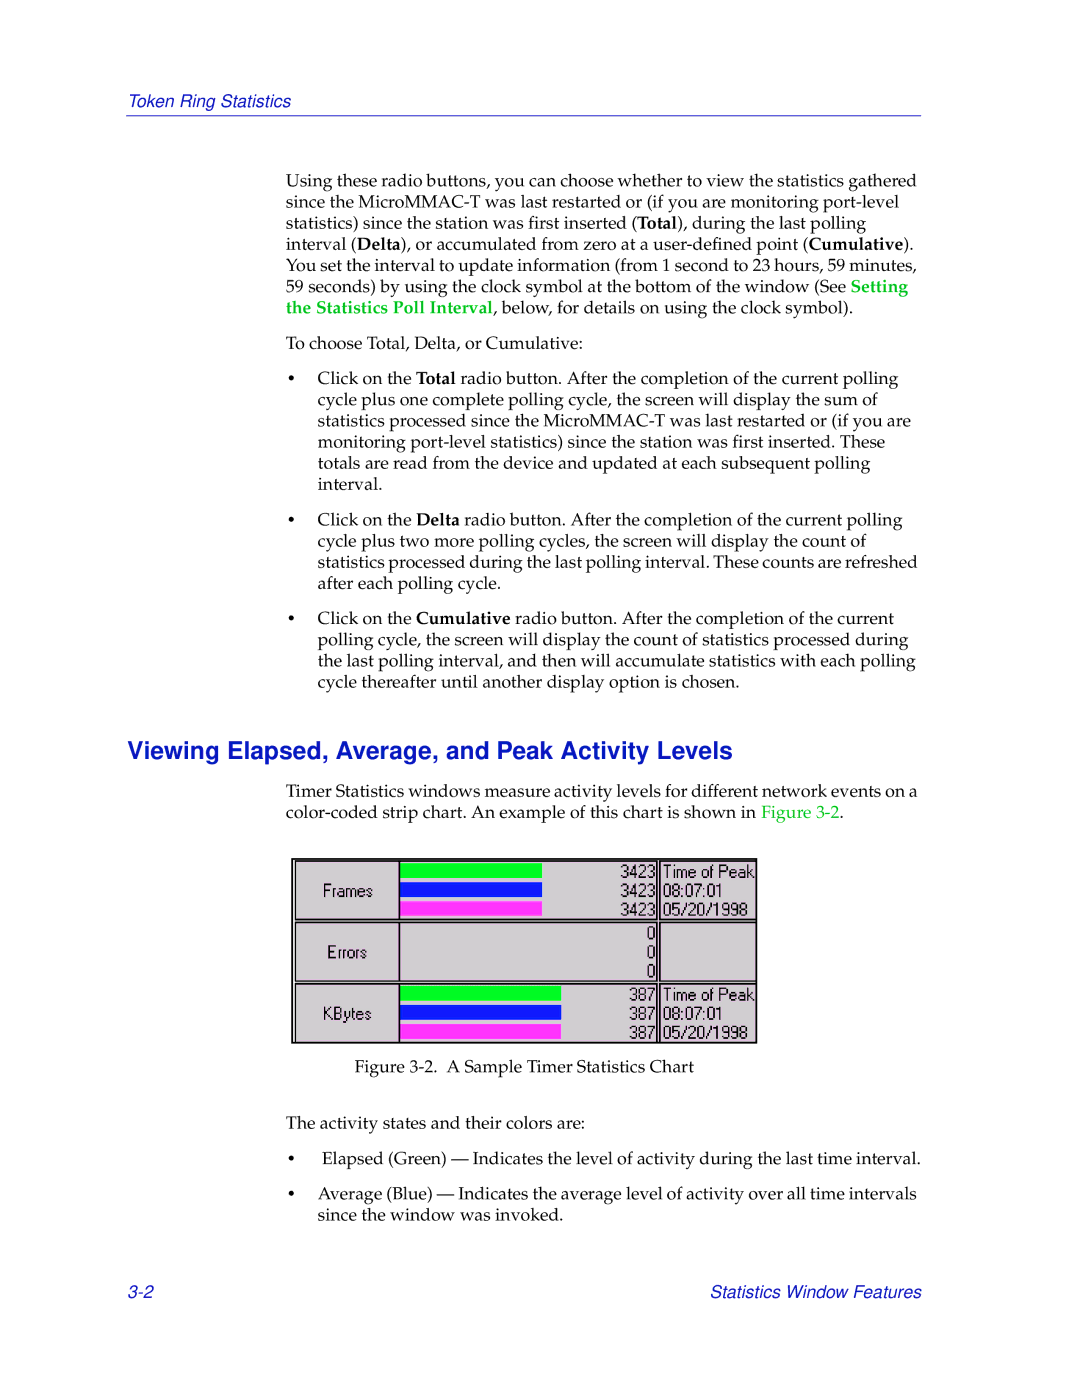
Timer Statistics windows measure activity levels for different network events on a
Figure 3-2. A Sample Timer Statistics Chart
The activity states and their colors are:
•Elapsed (Green) — Indicates the level of activity during the last time interval.
•Average (Blue) — Indicates the average level of activity over all time intervals since the window was invoked.
Statistics Window Features |