Token Ring Statistics
The Protocol Statistics Window
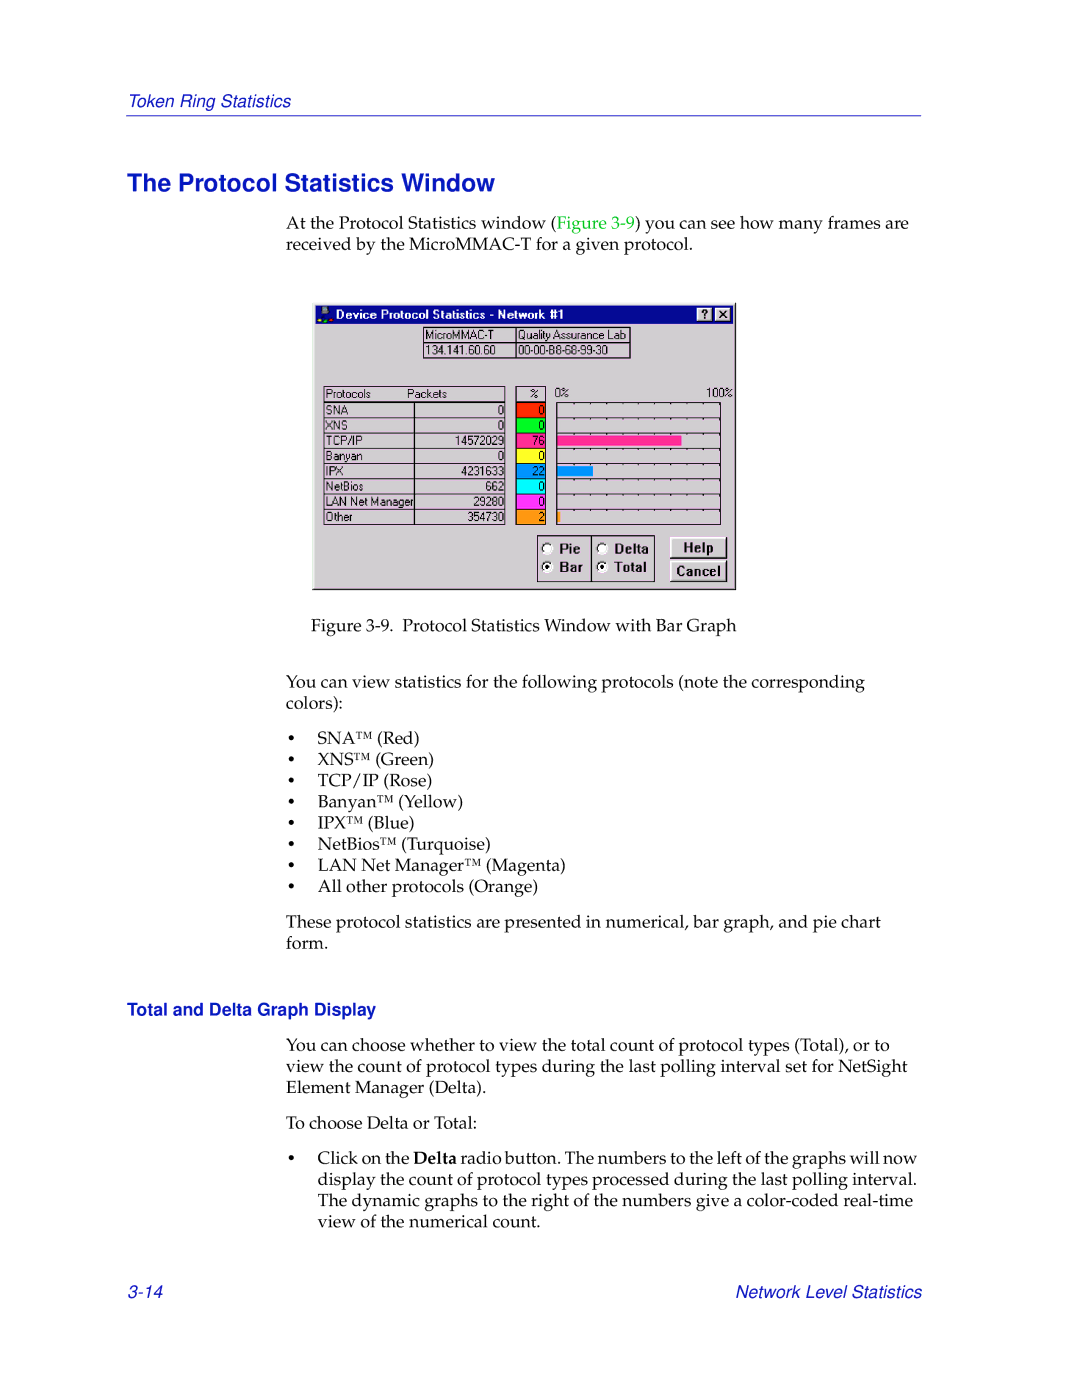
At the Protocol Statistics window (Figure
Figure 3-9. Protocol Statistics Window with Bar Graph
You can view statistics for the following protocols (note the corresponding colors):
•SNA™ (Red)
•XNS™ (Green)
•TCP/IP (Rose)
•Banyan™ (Yellow)
•IPX™ (Blue)
•NetBios™ (Turquoise)
•LAN Net Manager™ (Magenta)
•All other protocols (Orange)
These protocol statistics are presented in numerical, bar graph, and pie chart form.
Total and Delta Graph Display
You can choose whether to view the total count of protocol types (Total), or to view the count of protocol types during the last polling interval set for NetSight Element Manager (Delta).
To choose Delta or Total:
•Click on the Delta radio button. The numbers to the left of the graphs will now display the count of protocol types processed during the last polling interval. The dynamic graphs to the right of the numbers give a
Network Level Statistics |