Enterasys Networks MicroMMAC-T manual Network Performance Graphs, Frames, KBytes

Models: MicroMMAC-T

1 108
Download 108 pages 5.57 Kb
Page 66
Image 66

Token Ring Statistics

Frames

Displays the elapsed, average, and peak levels of good frames transmitted on the network.

Errors

Displays the elapsed, average, and peak levels of errors received by the network.

KBytes

Displays the elapsed, average, and peak levels of kilobytes processed by the network.

Network Performance Graphs

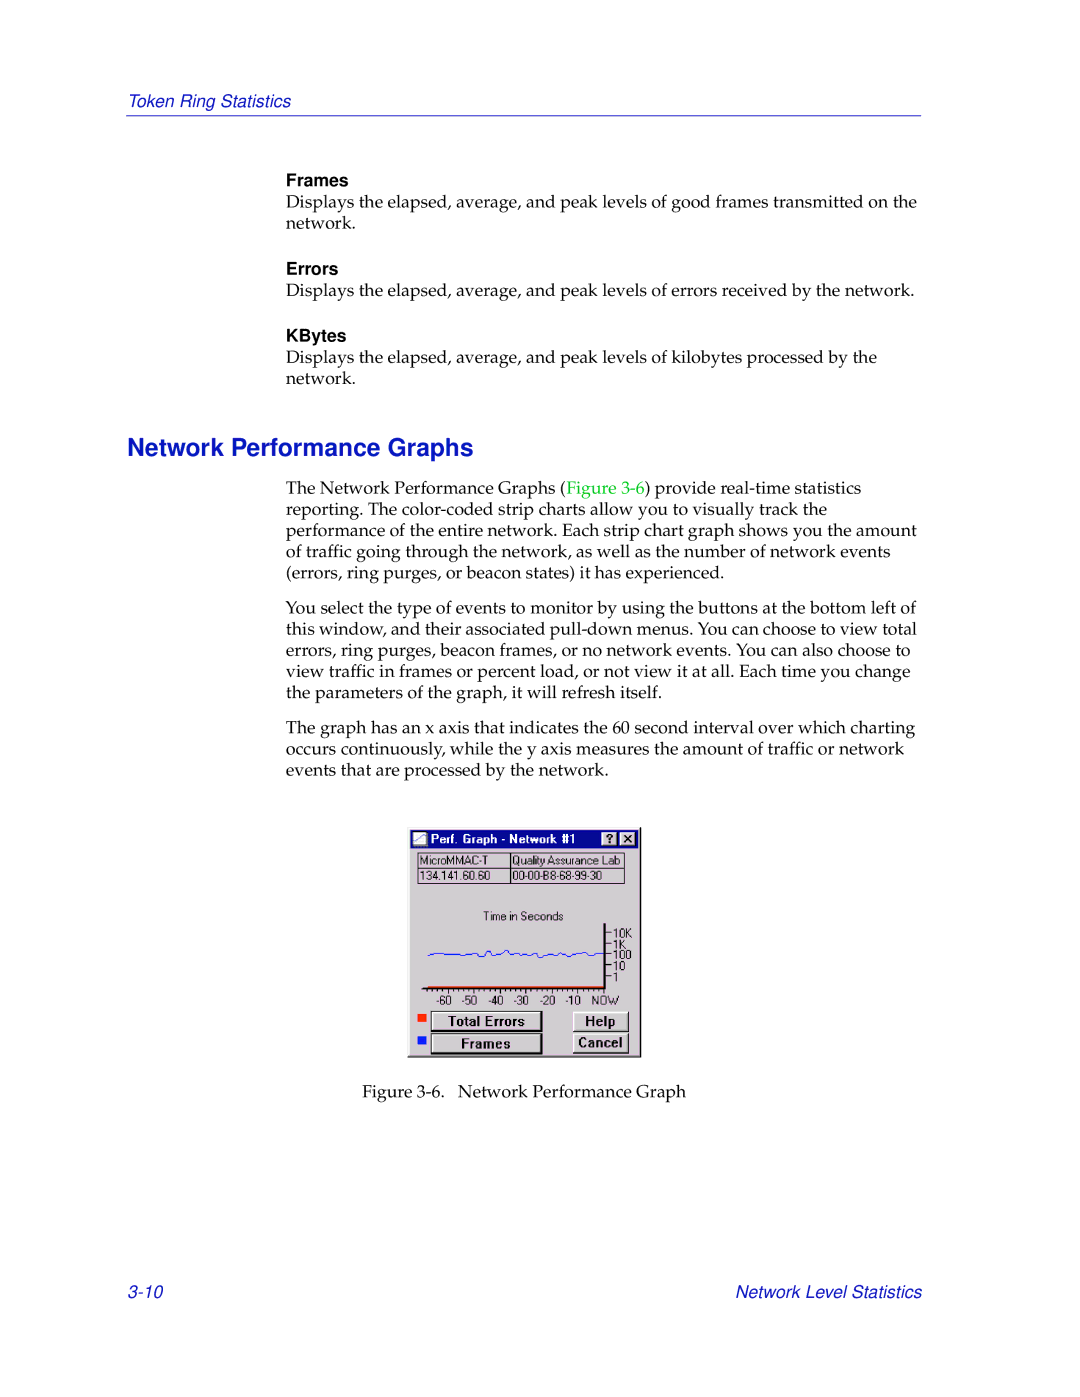
The Network Performance Graphs (Figure 3-6) provide real-time statistics reporting. The color-coded strip charts allow you to visually track the performance of the entire network. Each strip chart graph shows you the amount of traffic going through the network, as well as the number of network events (errors, ring purges, or beacon states) it has experienced.

You select the type of events to monitor by using the buttons at the bottom left of this window, and their associated pull-down menus. You can choose to view total errors, ring purges, beacon frames, or no network events. You can also choose to view traffic in frames or percent load, or not view it at all. Each time you change the parameters of the graph, it will refresh itself.

The graph has an x axis that indicates the 60 second interval over which charting occurs continuously, while the y axis measures the amount of traffic or network events that are processed by the network.

Figure 3-6. Network Performance Graph

3-10

Network Level Statistics

Page 66
Image 66
Enterasys Networks MicroMMAC-T manual Network Performance Graphs, Frames, KBytes