Token Ring Statistics
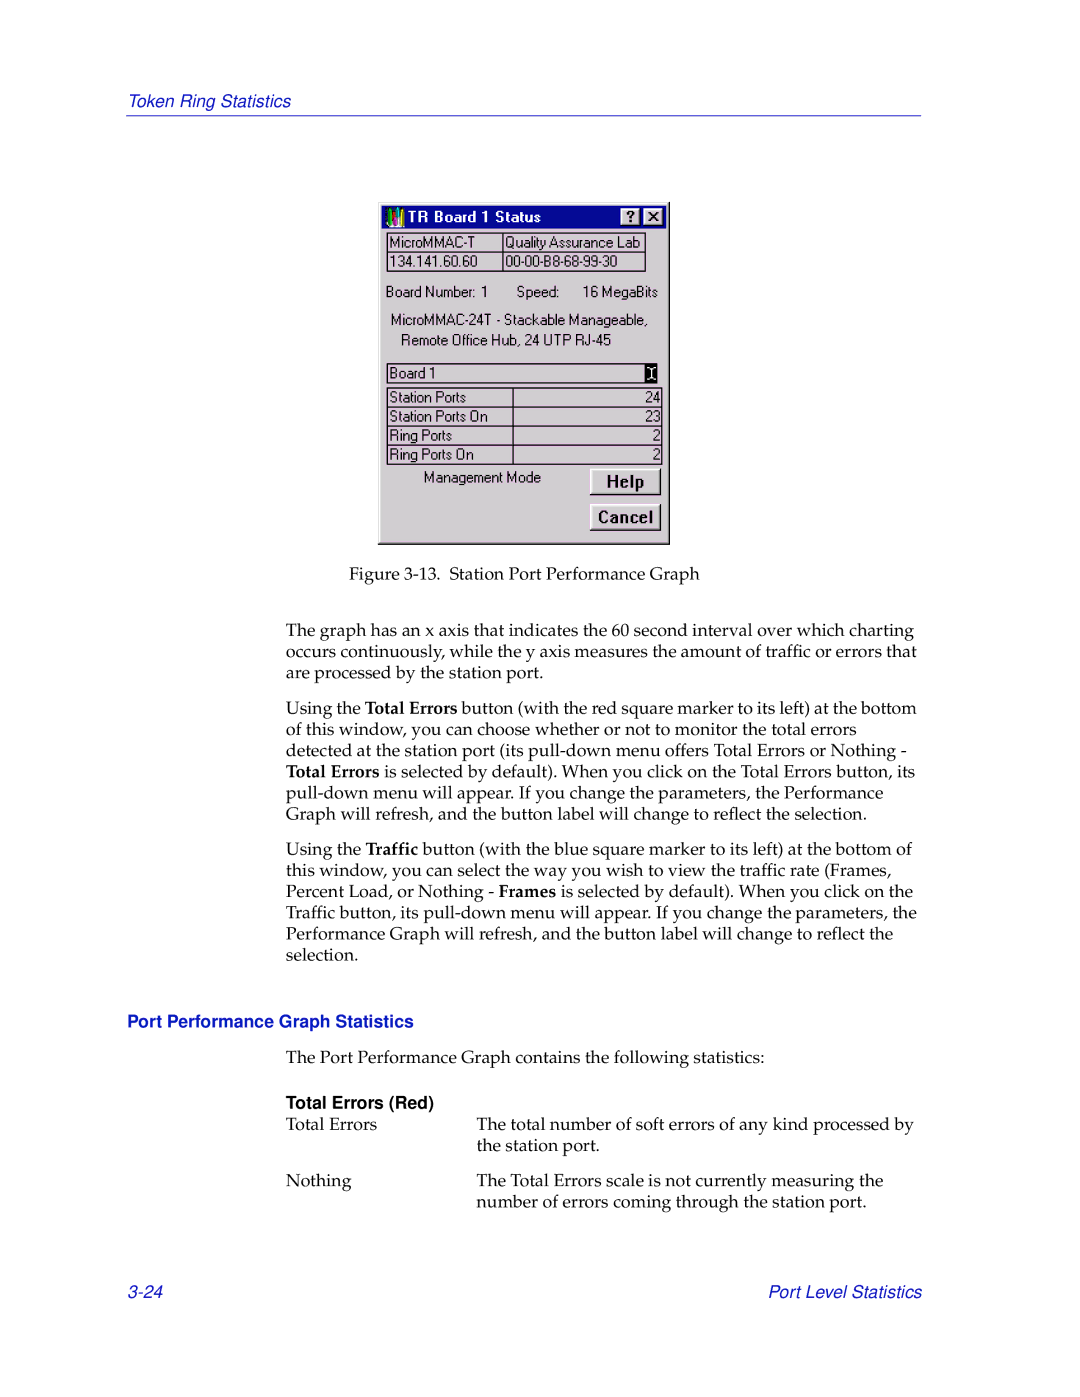
Figure 3-13. Station Port Performance Graph
The graph has an x axis that indicates the 60 second interval over which charting occurs continuously, while the y axis measures the amount of traffic or errors that are processed by the station port.
Using the Total Errors button (with the red square marker to its left) at the bottom of this window, you can choose whether or not to monitor the total errors detected at the station port (its pull-down menu offers Total Errors or Nothing - Total Errors is selected by default). When you click on the Total Errors button, its pull-down menu will appear. If you change the parameters, the Performance Graph will refresh, and the button label will change to reflect the selection.
Using the Traffic button (with the blue square marker to its left) at the bottom of this window, you can select the way you wish to view the traffic rate (Frames, Percent Load, or Nothing - Frames is selected by default). When you click on the Traffic button, its pull-down menu will appear. If you change the parameters, the Performance Graph will refresh, and the button label will change to reflect the selection.
Port Performance Graph Statistics
The Port Performance Graph contains the following statistics:
Total Errors (Red) |
|
Total Errors | The total number of soft errors of any kind processed by |
| the station port. |
Nothing | The Total Errors scale is not currently measuring the |
| number of errors coming through the station port. |
Port Level Statistics |