Token Ring Statistics

Click on the Total radio button. The numbers to the left of the selected graph (in the color-coded boxes) display the total count of frame sizes processed since the most recent start-up of the MicroMMAC-T. The dynamic bar graph or pie chart to the right of the numbers reflects counts processed since the last start-up.

Using the Pie and Bar Radio Buttons

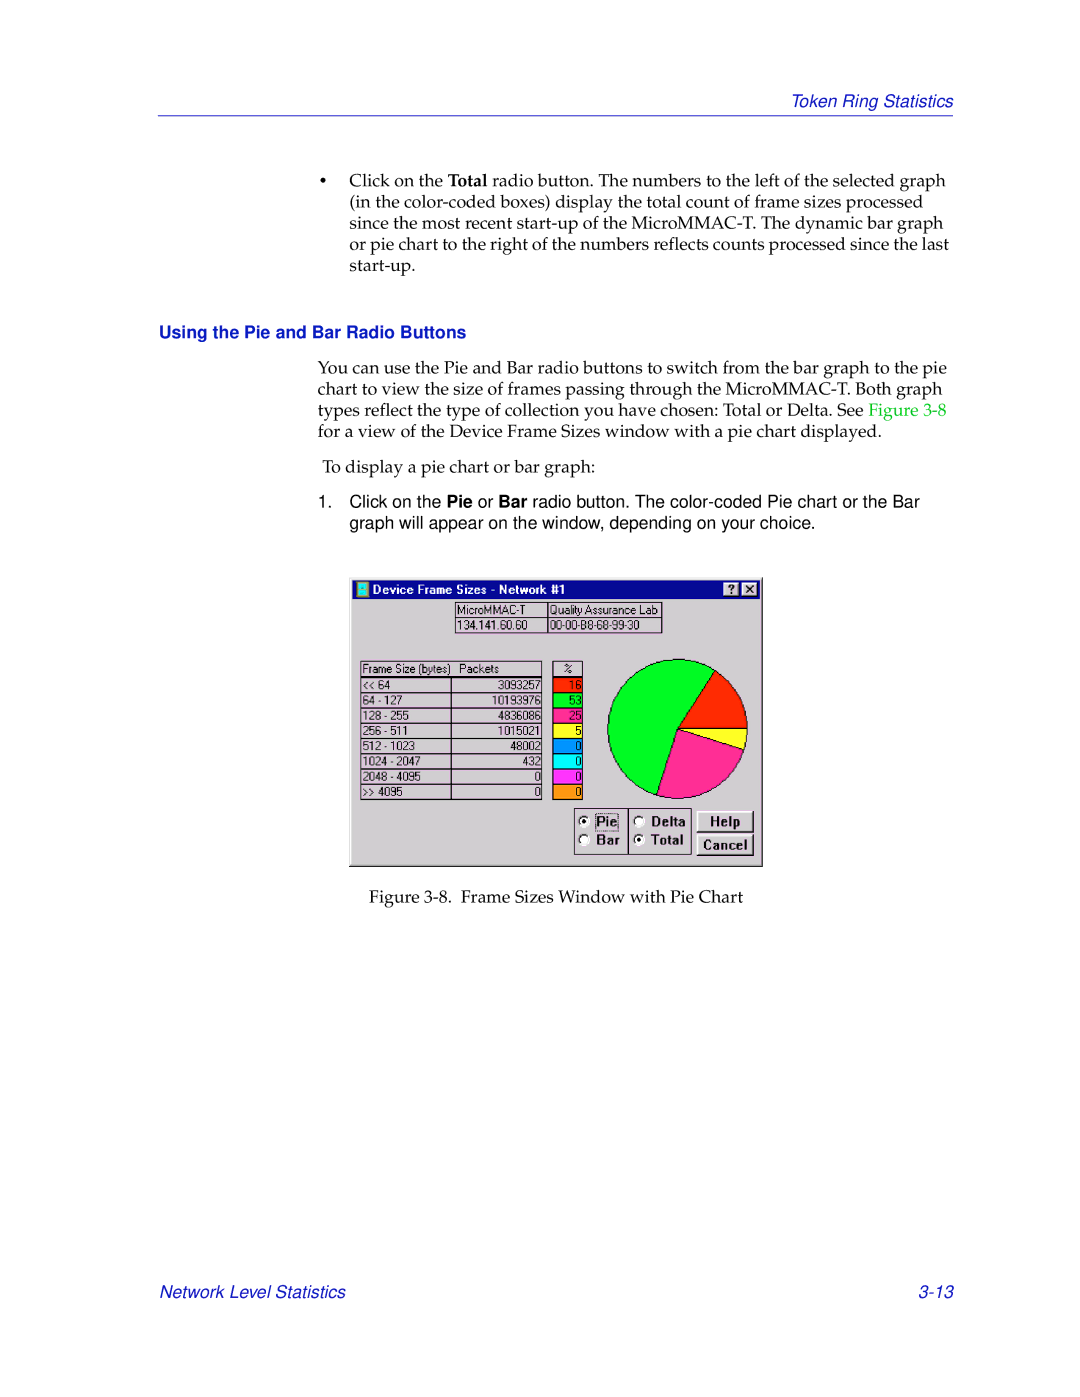
You can use the Pie and Bar radio buttons to switch from the bar graph to the pie chart to view the size of frames passing through the MicroMMAC-T. Both graph types reflect the type of collection you have chosen: Total or Delta. See Figure 3-8for a view of the Device Frame Sizes window with a pie chart displayed.

To display a pie chart or bar graph:

1.Click on the Pie or Bar radio button. The color-coded Pie chart or the Bar graph will appear on the window, depending on your choice.

Figure 3-8. Frame Sizes Window with Pie Chart

Network Level Statistics

3-13

Page 69
Image 69
Enterasys Networks MicroMMAC-T manual Using the Pie and Bar Radio Buttons, Frame Sizes Window with Pie Chart