Token Ring Statistics
Total Errors
The sum of all errors currently recorded.
Network Timer Statistics
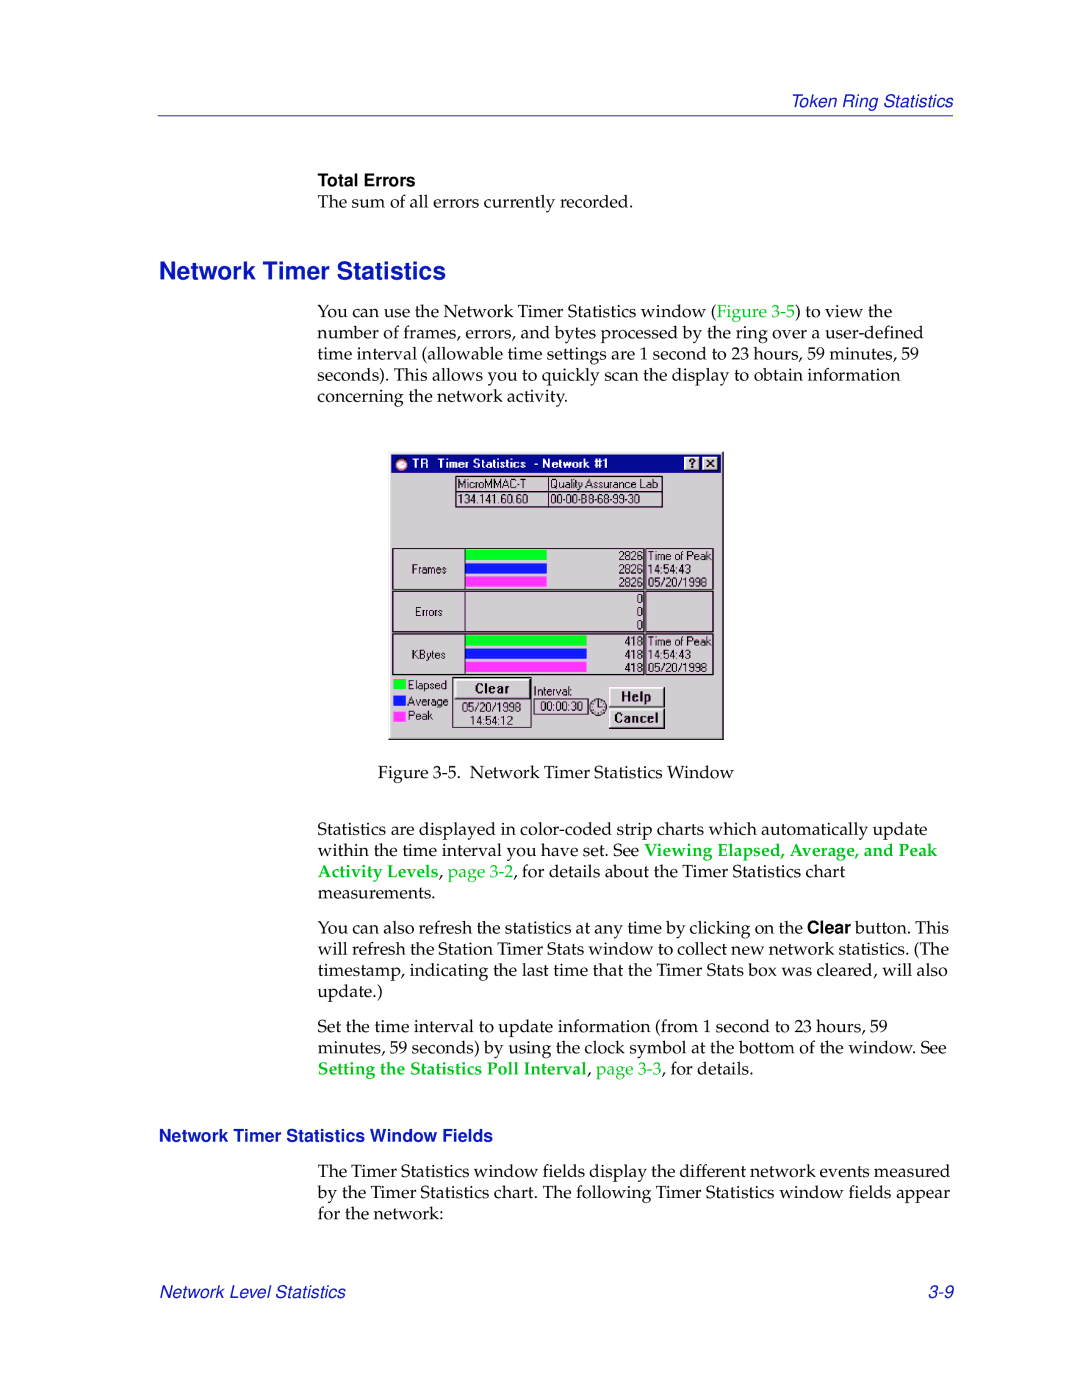
You can use the Network Timer Statistics window (Figure
Figure 3-5. Network Timer Statistics Window
Statistics are displayed in color-coded strip charts which automatically update within the time interval you have set. See Viewing Elapsed, Average, and Peak Activity Levels, page 3-2, for details about the Timer Statistics chart measurements.
You can also refresh the statistics at any time by clicking on the Clear button. This will refresh the Station Timer Stats window to collect new network statistics. (The timestamp, indicating the last time that the Timer Stats box was cleared, will also update.)
Set the time interval to update information (from 1 second to 23 hours, 59 minutes, 59 seconds) by using the clock symbol at the bottom of the window. See Setting the Statistics Poll Interval, page 3-3, for details.
Network Timer Statistics Window Fields
The Timer Statistics window fields display the different network events measured by the Timer Statistics chart. The following Timer Statistics window fields appear for the network:
Network Level Statistics |