HP Caliper User Guide
Copyright 2011 Hewlett-Packard Development Company, L.P
Contents
Remote GUI
HP Caliper Measurement Configuration Files
HP Caliper Options
Contents
Configuring HP Caliper
Using the HP Caliper Advisor
Using the HP Caliper Advisor in the GUI
Threads Traps-reported User-regionsHP-UX only Version
Producing a Sampled Call Stack Profile Analysis 132
Controlling the Content of Reports 104
Producing a Sampled Call Graph Profile Analysis 120
HP Caliper Environment Variables 103
Descriptions of Measurement Reports 168
HP Caliper Diagnostic and Warning Messages 164
Limitations to Using cstack 149 Pstack like functionality
Contents
Event Set Descriptions for CPU Metrics HP-UX only 219
Glossary 253 Index 258
About This Document
Computer output
Command
Typographic Conventions
File name
Related Documents
HP Encourages Your Questions
HP Caliper at a Glance
What Is HP Caliper?
HP Caliper at a Glance
What Is HP Caliper?
HP Caliper Components User Interfaces
Supported Compilers and Application Environments
What Does HP Caliper Run On?
Supported Hardware and Operating Systems
Summary of HP Caliper Features
Summary of HP Caliper Features
Getting Started with the HP Caliper Command-Line Interface
Getting Started with the HP Caliper Command-Line Interface
PLM
Target
Page
Example Adding Instructions to an fprof Report
Example Adding Instructions to an fprof Report
Sampled Measurements
Types of Measurements
Global Measurement
Precise Measurements
Caliper measurement caliperoptions program programarguments
What to Look for in Using HP Caliper
Syntax for caliper Command
Measurement
Stopping HP Caliper
Basic Tasks a Quick Reference
Starting HP Caliper
Showing HP Caliper Options
Creating a Text Report for Analysis
Using the HP Caliper Advisor
Restrictions on Using HP Caliper
Creating a Report Based on Your Collected Data
Caliper info
Additional HP Caliper Commands
Getting Information About HP Caliper
Caliper report merge diff
Getting Started with the HP Caliper GUI
What Is the HP Caliper GUI?
What Is the HP Caliper GUI?
Window Basics
Projects View
Getting Started with the HP Caliper GUI
Collect View
Window Basics
Analyze View
Collect View
Advisor View
Analyze View
Console View
Advisor View
Diagnostics View
Help View
Making Measurements
Tips for Using Views
Hints on How to Make Measurements
Exploring Performance Data
Getting Performance Tuning Advice
Exploring Performance Data
Native Local GUI
Getting Help
Starting the GUI
Remote GUI
Login Screen
Starting the GUI
HP Caliper Measurement Configuration Files
Measurement Configuration Files Provided with HP Caliper
Fprof
Dtlb
Ecount
Icache
Global Sampled
Overview Measurement
Available Measurements in Each Measurement Type
Simultaneous fprof Sampling on Multiple PMU Counters
Location of Measurement Configuration Files
Simultaneous fprof Sampling on Multiple PMU Counters
See Hierarchy for Processing an Option Value p
Specifying Option Values in Measurement Configuration Files
You are free to rename measurement configuration files
Multiple Ways to Specify HP Caliper Option Values
HP Caliper Options
Basic Information About Options
Examples
Hierarchy for Processing an Option Value
Or --database
Or --duration
Examples
Or --help
Or --options-file
Or -?
Or --metrics
Or --output-file
Cpuevent
For PMU Histogram Reports
Or --process
Or --report-details
Speriod Srate ,variation ,cpuevent
Or --sampling-spec
For Function Coverage Reports
Rate
CPUCYCLES,10000,10%
Default value is 5 percent
Or --version
Branchevent
Advice-details
Advice-classes
Advice-cutoff
Analysis-focus
Bus-speed int
Bus-speed
Callpath-cutoff
Callpath-cutoffpercentcutoff,cumpercentcutoff,mincount
Cpu-counter
Context-lines
Cpu-aggregation
Cpu-details
Database
Csv-file
Dcache-data-profile
Dbrp
Details
Db-save
Description-details
Detail-cutoff
Example
Etb-freeze-delay
Duration
Etb-walkback-cycles
Event-defaults
Event-defaults privilege-level-mask=levelthreshold=int
Etb-walkback-cycles integer
Fold
Exclude-caliper
Exclude-idle
Frame-depth
Ibrp
Help
Hotpaths
Info
Kernel-path
Join
Jre
Kernel-stack
Memory-usage=
Latency-buckets
Measure-on-interrupts
Metrics
Module-include
Module-default
Module-exclude
Module-search-path
Options-file
Noinlines
Omr
Output-file
Percent-sample
Per-module-data
Percent-columns
Prim-cutoff
See -p or --process p
Process
Process-cutoff
Process-cutoffpercentcutoff,cumpercentcutoff,mincount
Report-details
Read-init-file
Report
Rule-files
Using --scope system for System-Wide Measurements
Psetid psetid
Sort-by
Search
Skip-functions
Sort-bymetric,cpuevent
Summary-cutoff
Source-path-map
Stop-functions
Summary-cutoffpercentcutoff,cumpercentcutoff,mincount
Term-display
System-model Linux only
System-usage=
System-modelmodel-number,number-of-cells
User-regions
Threads
Traps-reported
Version
Version
See -v or --version p
Example of an HP Caliper Advisor Report
Using the HP Caliper Advisor
What Is the HP Caliper Advisor?
Limitations to Keep in Mind
Example 1 HP Caliper Advisor Report
Steps in Using the Advisor
Steps in Using the Advisor
Where adviseoptions are
Command Line to Invoke the Advisor
Command line is
Advice-details
Advice-classes
Advice-cutoff
Max-count
More Typical Examples
Getting Started with the Advisor Examples
Simplest Example
Then, run the Advisor on the composite performance data
Explanation of Report Output
Followed by
How to Read an Advisor Report
Suggestions for Using the HP Caliper Advisor
Suggestions for Using the HP Caliper Advisor
How the HP Caliper Advisor Works
Basic Steps in Using the HP Caliper Advisor in the GUI
Using the HP Caliper Advisor in the GUI
Basic Steps in Using the HP Caliper Advisor in the GUI
Making Performance Measurement Runs
Using the HP Caliper Advisor in the GUI
Selecting Performance Data to Analyze Optional
Projects View, with a Single Project Selected
Selecting Performance Data to Analyze Optional
Generating Advice
Projects View, with a Single Measurement Run Selected
Reviewing and Acting on the Advice
Reviewing and Acting on the Advice
Advisor Report in the HP Caliper GUI
Caliperinit file, you can then simply type
Configuring HP Caliper
Example of a .caliperinit File
Suppressinitwarnings = TrueFalse
Setting Constants in the .caliperinit File
Disasmtargetnamelimit = limit
Suppressstatementdata = TrueFalse
Specifying Which CPU Events to Measure
Configuring Data Collection
Configuring Data Collection
Shortening CPU Event Names
Module-include modulelist
Module-default Module-include Module-exclude
Specifying Which Load Modules to Collect Data For
Module-exclude modulelist
Default Settings for Load Module Data Collection
How to Specify Load Module Names
Process Tree Report
Controlling Granularity of Data Collection and Reports
Specifying Processes to Measure
For more information, see -s or --sampling-spec p
Root-forks
Default
Syntax for -p Option
Customfunctionname
Someopt1,opt2,...pattern
Using -p some
Some opt1,... pattern Glob1 glob2
To measure only ecom and ld
Examples of the -p Option
Process Origin Options Used with -p some
Reports information for cc root, cc fork, cc fork, ctcom
Using HP Caliper to Generate Test Suite Reports
Using HP Caliper in Your Build Process
Using HP Caliper in Testing and Quality Assurance
Attaching to a Running Process to Perform Measurements
Options for the caliper info Command
Example Output of the caliper info Command
Examples of the caliper info Command
HP Caliper Environment Variables
Layout of an HP Caliper Text or CSV Report
Controlling the Content of Reports
Controlling the Content of Reports
Metrics You Can Use for Report Sorting and Cutoffs
Metrics You Can Use for Report Sorting and Cutoffs
Available Metrics for Report Sorting and Cutoffs
This produces a report similar to this truncated report
Module-Centric Reports
For example, assume that you perform this HP Caliper run
Process Summary for a Diff Run
Process Summary
Process Summary for a --group-by none Run
Function Details
Disassembly Listing
Function Details
Address Types Shown
Branch Targets in Disassembly Listings
Source Position Correlation
Source Line Data
Unnamed Functions
How Functions Are Named in Reports
VSE Information Shown in Report Output
Unknown Functions
Controlling the Content of Reports
Names and Locations for the Databases
Changing the Default Name and Location
How HP Caliper Saves Data in Databases
Or simply
Creating Reports from Multiple Databases
You can use the caliper report merge diff command to
Where reportoptions is one or more of these options
Caliper report merge diff reportoptions databases
Caliper report reportoptions database
Databases is one of these
Database2 database1 for caliper diff
Caliper merge reportoptions database1 database2
Example 2 Example of a caliper merge Run
Cpucycles
Pmutrace Scgprof
Caliper diff reportoptions database2 database1
Example 3 Example of a caliper diff Run
As cc1 ld
Example of How to Use the caliper diff Command
Cstack Pmutrace Scgprof
As cc1
Differences Between scgprof and cgprof
Producing a Sampled Call Graph Profile Analysis
How Sampled Call Graph Profile Analysis Works
Producing a Sampled Call Graph Profile Analysis
Caliper scgprof caliperoptions program programarguments
Running the HP Caliper Sampled Call Graph Profile
Sampled Call Graph Text Report Example
Running the HP Caliper Sampled Call Graph Profile
Sampled Call Graph Text Report Example
Sampled Call Graph Text Report Example
Producing a Sampled Call Graph Profile Analysis
Br.cond.dpnt.many self+0x2db0
Producing a Sampled Call Graph Profile Analysis
Sampled Call Graph Text Report Example
Producing a Sampled Call Graph Profile Analysis
Root
Call Graph Part of the Report
Sampled Call Graph Profile Report Details
Flat Profile Part of the Report
Hot Call Paths Part of the Report
Gprof Fallacy and Possibly Misleading Results
Diagnostic Messages
Diagnostic Messages appear at the end of the report
Gprof Fallacy and Possibly Misleading Results
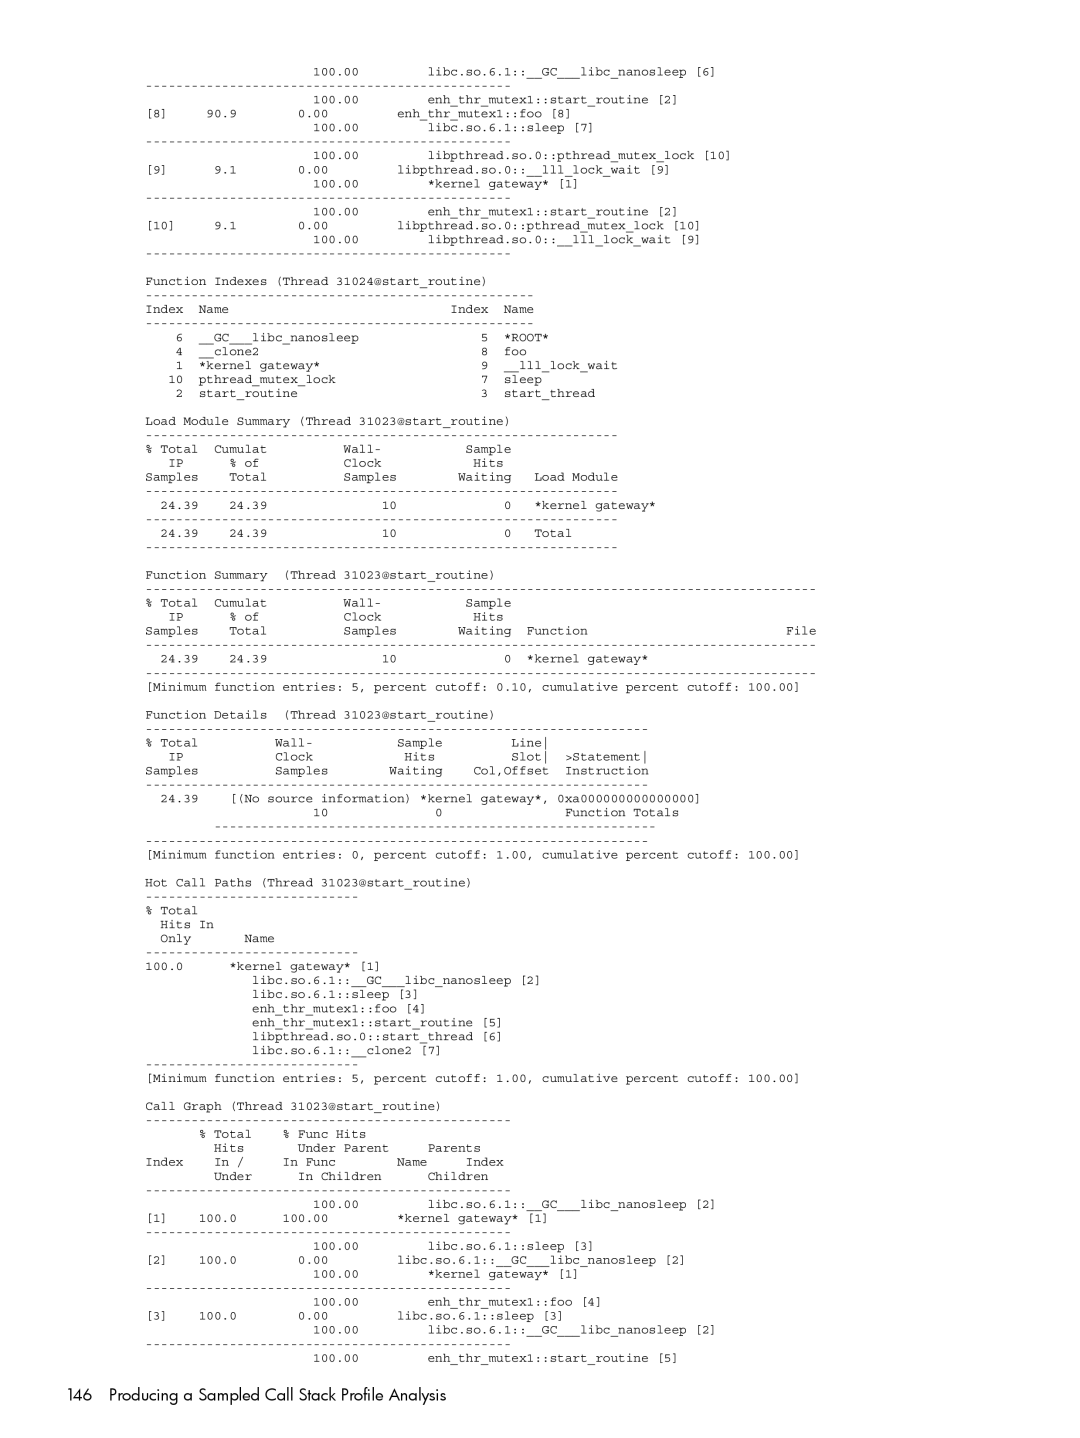
Call Stack Profile Text Report Example for HP-UX
Producing a Sampled Call Stack Profile Analysis
Running HP Caliper to Produce a Call Stack Profile
Caliper cstack caliperoptions program programarguments
Call Stack Profile Text Report Example
Call Stack Profile Text Report Example for HP-UX
Producing a Sampled Call Stack Profile Analysis
Call Stack Profile Text Report Example for HP-UX
Root
Call Stack Profile Text Report Example for HP-UX
Producing a Sampled Call Stack Profile Analysis
Function Indexes Thread 6065598@startroutine Name
Call Stack Profile Text Report Example for Linux
An example report for HP Caliper on Linux is shown here
Call Stack Profile Text Report Example for Linux
Call Stack Profile Text Report Example for Linux
Producing a Sampled Call Stack Profile Analysis
Root
Producing a Sampled Call Stack Profile Analysis
Call Stack Profile Text Report Example for Linux
Producing a Sampled Call Stack Profile Analysis
Samples-running HP-UX only Samples-blocked HP-UX only
Call Stack Profile Report Details
Blocking Primitives Summary Part of the Report
Call Stack Profile Report Details
Example 4 Sample cstack Report Blocking Primitives Details
Pstack like functionality
Limitations to Using cstack
Avoids gprof Fallacy
Sample report follows
Producing a Sampled Call Stack Profile Analysis
Performing CPU Metrics Analysis
151
HP Caliper Features Specific to HP-UX
Measuring Memory Usage Concurrently with Other Measurements
Examples of the --memory-usage= Option
Example Report Output
How to Read the Reports
System Memory Configuration Table
Process Memory Usage Table
Measuring System Usage Concurrently with Other Measurements
Example System Usage Report Output
Measuring System Usage Concurrently with Other Measurements
Interpreting the Data
Caliper measurement options pid
Run ./myprog and find the process ID of the process
Taking PMU Samples in Your Code
Triggering PMU Samples in Specific Code Regions
Taking PMU Samples in Your Code
Precautions When Using Triggered Samples
160 shows part of the resulting report
Restricting PMU Measurements to Specific Code Regions
Caliperpmuenable
Restricting PMU Measurement to Specific Code
HP Caliper Diagnostic and Warning Messages
HP Caliper Diagnostic and Warning Messages
Error #28 Caliper Invalid Measurement Combination
Instructions Labeled Stub
Mispredicted Branches Example
Mispredicted Branches
PMU Sample Hits Outside Function Range
Scgprof Reports Require Kernel Patch
Scgprof Reports Require Kernel Patch
Descriptions of Measurement Reports
Example Command Line for Text Report
Example Command Line for CSV Report
Alat Measurement Report Description
Alat Metrics Summed for Entire Run
Metrics for Integrity Servers Itanium 2 Systems
INSTCHKALDCALAT.INT
Alat Measurement Report Metrics
INSTCHKALDCALAT.FP
INSTFAILEDCHKALDCALAT.FP
Information in alat Measurement Reports
Branch Measurement Report Description
How Alat Metrics Are Obtained
Branch Metrics Summed for Entire Run
BRMISPREDDETAIL.RETURN.CORRECTPRED
BRMISPREDDETAIL.NRETIND.WRONGPATH
BRMISPREDDETAIL.NRETIND.WRONGTARGET
BRMISPREDDETAIL.RETURN.WRONGPATH
Branch Measurement Report Metrics
Information in branch Measurement Reports
Available only on HP-UX
Cgprof Report Description
How branch Metrics Are Obtained
For rows showing instructions on a bundle boundary
Profiled otherwise blank
HP Caliper Call Graph Profile Results Accuracy
Call Graph Profile Metrics
Information in cgprof Measurement Report Parent Listings
Column Description Func Hits In Children
Cpu Measurement Report Description
Information in cgprof Measurement Report Children Listings
This child entry
Example Command Lines for Text Report
CPU Event Sets
L1icache
Dspec
L1dcache
L2cache
Cstack Measurement Report Metrics
Threadswitch
Cstack Measurement Report Description
Sysbus
Message queue, socket, pipe, file descriptor
Be resolved to a symbol
Column Description Total Hits Waiting
Semaphore, message queue, socket, pipe, file descriptor
Children
Cycles Measurement Report Description
Parent Func Hits
Cycles Measurement Report Description
Cycles Metrics Summed for Entire Run
Cycles Measurement Metrics
Information in cycles Measurement Reports
How cycles Metrics Are Obtained
From that bundle are split issued
Dcache Measurement Report Description
L1DREADMISSES.ALL
Dcache Metrics Summed for Entire Run
L1DREADS
L2DMISSES
Datareferences
L2DINSERTMISSES
Information in dcache Measurement Reports
Dcache Measurement Report Metrics
L2DREFERENCES.ALL
Cycles Object Avg. Dcache
Example dcache Reports
Dcache Measurement Report Description
How Data Cache Metrics Are Obtained
How the Data Summary Information Is Obtained
Dtlb Measurement Report Description
How Latency Bucket Metrics Are Obtained
Dtlb Measurement Report Description
Dtlbinsertshpw
Dtlb Metrics Summed for Entire Run
L2DTLBMISSES
L2DTLBMISSES / Datareferences
Dtlb Measurement Report Metrics
Cycles lost due to all stalls lower is better
Information in dtlb Measurement Reports
How Data TLB Metrics Are Obtained
Function Source statement Instruction
Cpucycles
Ecount Measurement Report Description
Ecount Metrics Summed for Entire Run
Ecount Measurement Report Description
Descriptions of Measurement Reports
Fcount Measurement Report Metrics
Fcount Measurement Report Description
Fcover Measurement Report Description
Fcover Measurement Report Metrics
Directory
Fprof Measurement Report Description
Unknown Source Files
Function
Full pipe bubbles in main pipe
Fprof Metrics Summed for Entire Run
Number of elapsed processor cycles
Fprof Measurement Report Description
Fprof Measurement Metrics
How fprof Metrics Are Obtained
Information in fprof Measurement Reports
L1IREADS
Icache Measurement Report Description
Icache Metrics Summed for Entire Run
L2INSTDEMANDREADS
L1IPREFETCHES
Information in icache Measurement Reports
Icache Measurement Report Metrics
That are misses
Function Details
How Instruction Cache Metrics Are Obtained
ITLBMISSESFETCH.L1ITLB
Itlb Measurement Report Description
Itlb Metrics Summed for Entire Run
ITLBMISSESFETCH.L2ITLB
Itlb Measurement Report Description
Itlb Measurement Report Metrics
BELOSTBWDUETOFE.IMISS
Function Statement Cache line
Information in itlb Measurement Reports
How Instruction TLB Metrics Are Obtained
Pmutrace Measurement Report Description
Scgprof Measurement Report Description
Pmutrace Measurement Report Description
Is profiled otherwise blank
Scgprof Measurement Report Metrics Flat Profile
Scgprof Measurement Report Metrics Call Graph Profile
Information in scgprof Measurement Report Parent Listings
Scgprof Measurement Report Description
Traps Measurement Report Description
Dbit
Vfault
Darght
Debug
Traps Metrics Summed for Entire Run
Information in traps Measurement Reports
Traps Measurement Metrics
Cycles lost due to RSE stalls
How traps Metrics Are Obtained
Metrics Available from this Measurement
Event Set Descriptions for CPU Metrics
Brpath Event Set
Include idle --exclude-idle False
Brpred Event Set
Event Set Descriptions for CPU Metrics
Iprel
Brpred Event Set
C2c Event Set
Cpi Event Set
Cpi Event Set
Mips
Pred-Off
CPI
Cpubus Event Set
Cpubus Event Set
Available only on Itanium 2 and dual-core Itanium 2 systems
Cspec Event Set
Dispersal Event Set
Dispersal Event Set
Dspec Event Set
Dspec Event Set
Fp Event Set
FCVT.fx
SIR
Fp Event Set
L1dcache Event Set
L1icache Event Set
L1icache Event Set
NON RSE Misses per Kinst
Metrics Available from this Measurement
L2cache Event Set
L2cache Event Set
Metrics Available from this Measurement
L2dcache Event Set
L2dcache Event Set
L2icache Event Set
L2icache Event Set
L3cache Event Set
L3cache Event Set
Memreq Event Set
Queues Event Set
Queues Event Set
Snoop Event Set
Stall Event Set
Stall Event Set
Metrics Available from this Measurement
Sysbus Event Set
Sysbus Event Set
Bril
CPU
BRL
BRC
Threadswitch Event Set
BWL
BIL
Tlb Event Set
Tlb Event Set
Event Set Descriptions for CPU Metrics
Glossary
253
Set p
Glossary
Hot spot
255
Nop
Measurements p
257
Symbols
Index
259
CPU event names shortening, 93 CPU events
Daemon processes measuring
Environment variables HP Caliper, 103 Error messages
Sampled measurements performing
261
Useparensforstatementdata constant