Monitoring Your Server
Monitoring Your Server
You can monitor your Altix 450 server from the following sources:
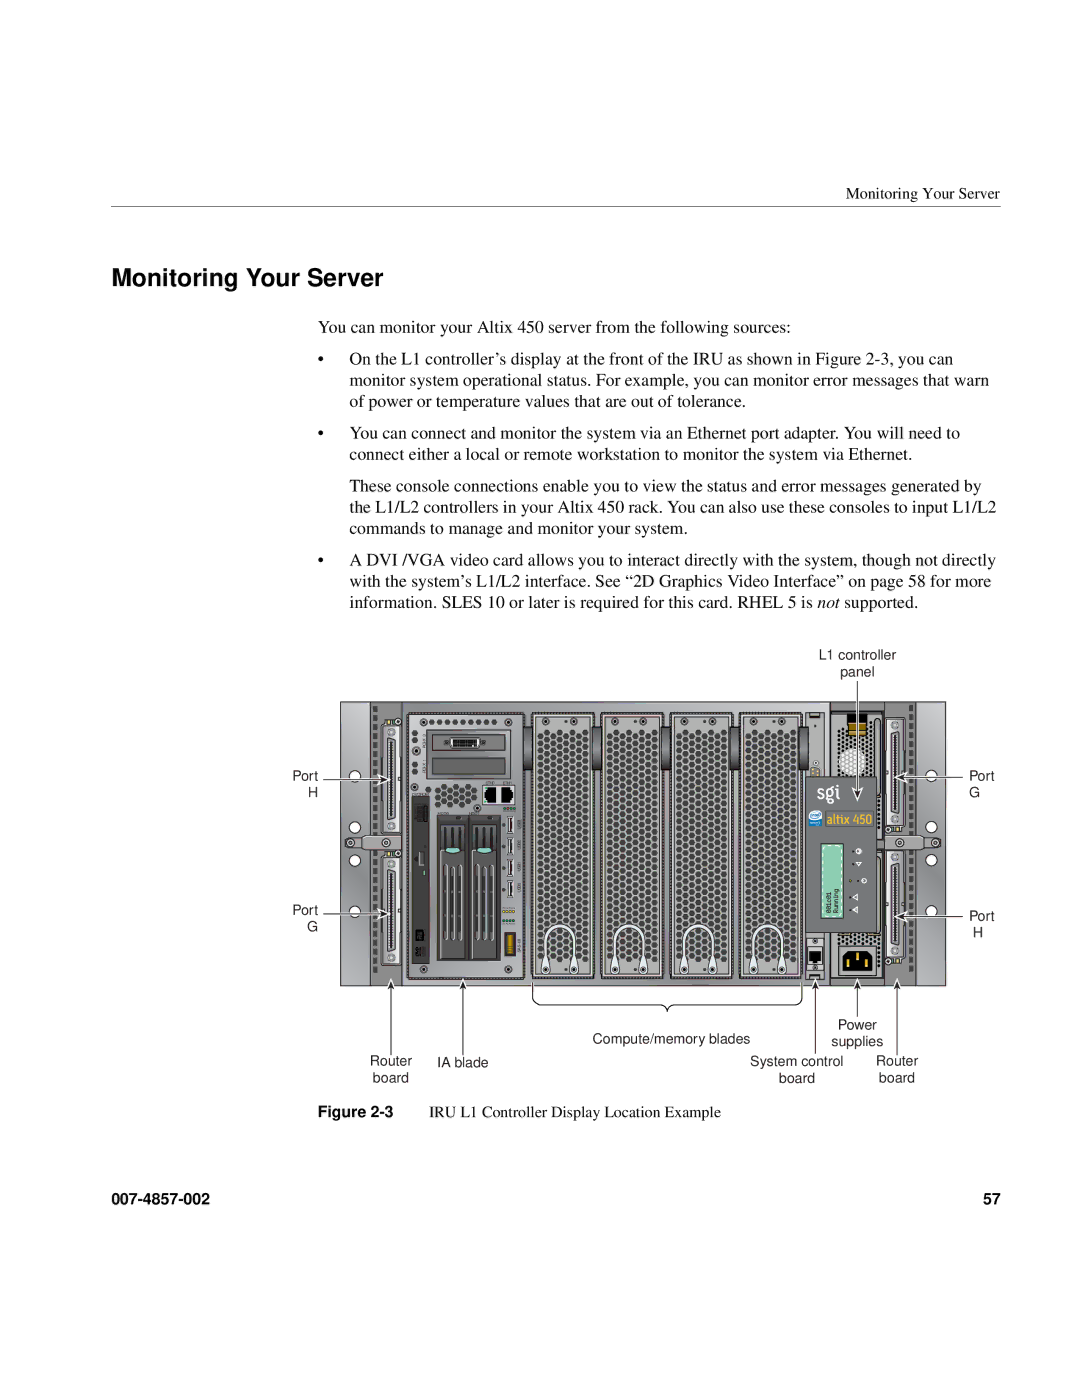
•On the L1 controller’s display at the front of the IRU as shown in Figure
•You can connect and monitor the system via an Ethernet port adapter. You will need to connect either a local or remote workstation to monitor the system via Ethernet.
These console connections enable you to view the status and error messages generated by the L1/L2 controllers in your Altix 450 rack. You can also use these consoles to input L1/L2 commands to manage and monitor your system.
•A DVI /VGA video card allows you to interact directly with the system, though not directly with the system’s L1/L2 interface. See “2D Graphics Video Interface” on page 58 for more information. SLES 10 or later is required for this card. RHEL 5 is not supported.
Port
H
Port
G
|
|
|
|
| L1 controller | |
|
|
|
|
| panel |
|
|
|
|
|
|
| |
|
|
|
|
| Port | |
|
| ETH0 | ETH1 |
|
| |
DVDROM |
|
|
|
|
| G |
| HDD0 | HDD1 | P0 PF N0 N1 |
|
|
|
|
|
|
|
| ||
|
|
|
| USB3 | inside |
|
|
|
|
| USB2 |
|
|
|
|
|
| USB1 |
|
|
|
|
|
| USB0 |
|
|
|
|
| F1 F2 F3 F4 |
|
| Port |
|
|
| A1 A2 A3 A4 |
|
| |
|
|
|
| SAS 4X |
| H |
|
|
|
|
|
| |
|
|
|
| Compute/memory blades | Power | |
|
|
|
| supplies | ||
Router | IA blade |
| System control | Router | ||
board |
|
|
| board |
| board |
Figure 2-3 IRU L1 Controller Display Location Example
57 |
