Tone curve and histogram corrections
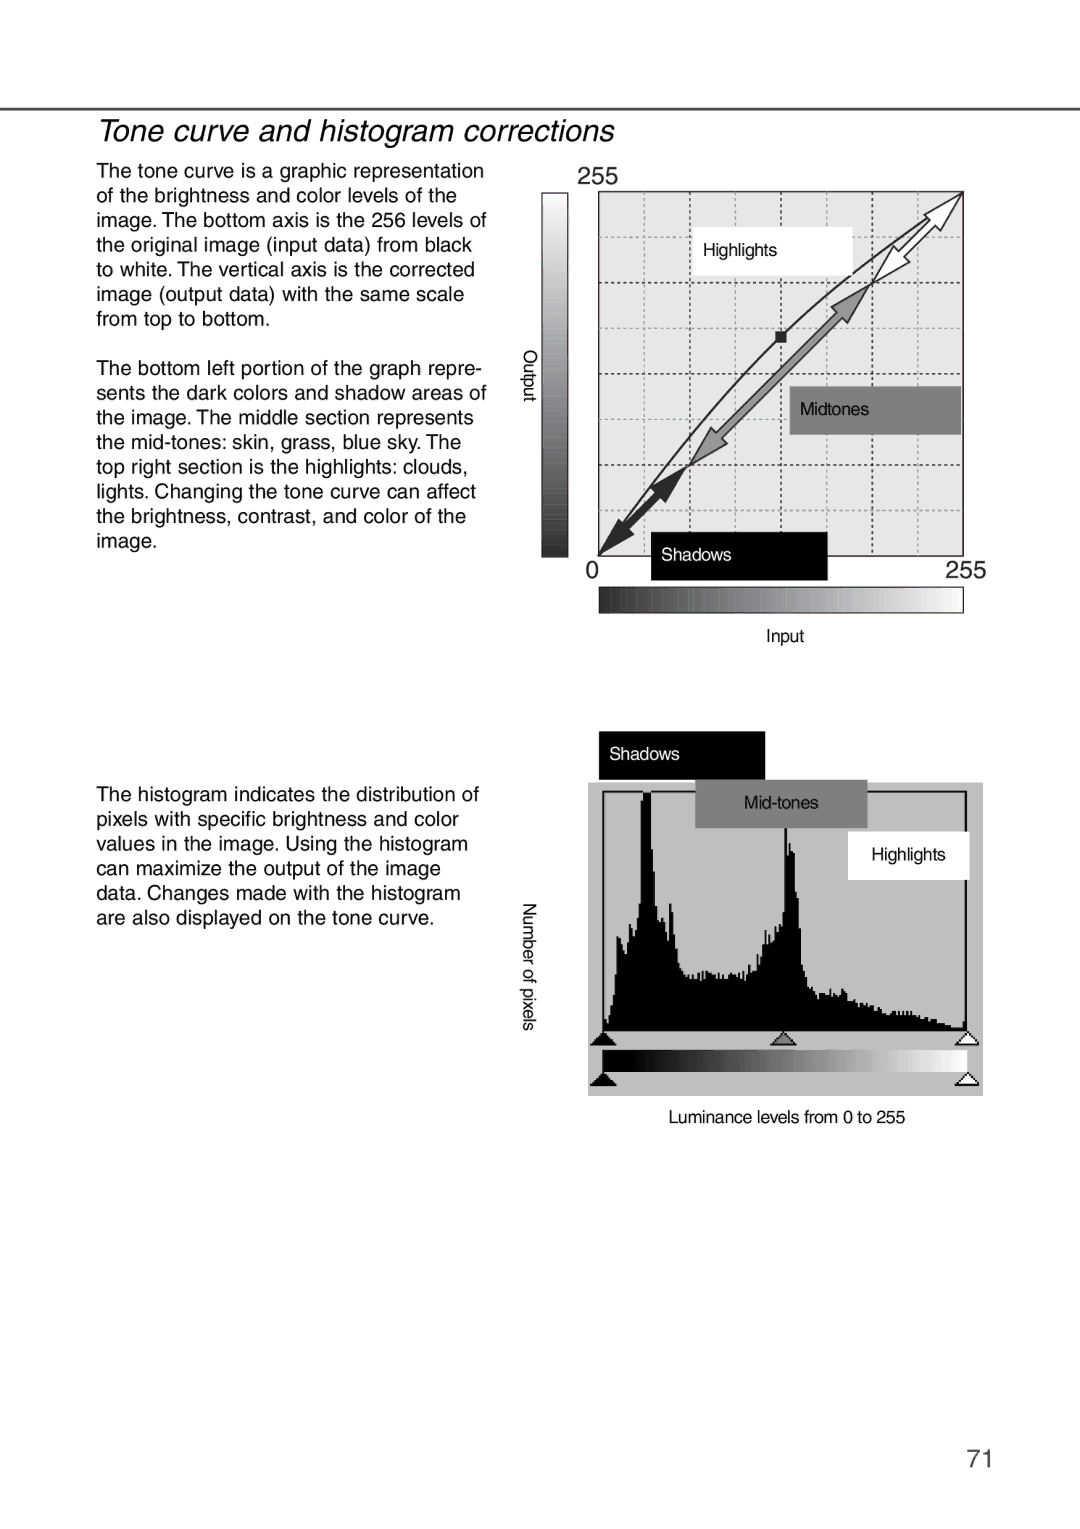
The tone curve is a graphic representation of the brightness and color levels of the image. The bottom axis is the 256 levels of the original image (input data) from black to white. The vertical axis is the corrected image (output data) with the same scale from top to bottom.
The bottom left portion of the graph repre- sents the dark colors and shadow areas of the image. The middle section represents the
Output
Highlights |
Midtones |
Shadows |
Input |
Shadows |
The histogram indicates the distribution of pixels with specific brightness and color values in the image. Using the histogram can maximize the output of the image data. Changes made with the histogram are also displayed on the tone curve.
Highlights
Number of pixels
Luminance levels from 0 to 255
71