SANbox2-64 Switch Management User’s Guide
Document Revision History
SANbox2-64 Switch Management User’s Guide
Table of Contents
Section Managing Fabrics
Section Managing Switches
Displaying Switch Information
Link Data Window
Section Managing Ports
Managing I/O Blades
Appendix a Command Line Interface
Command Syntax
Port Information Data Window
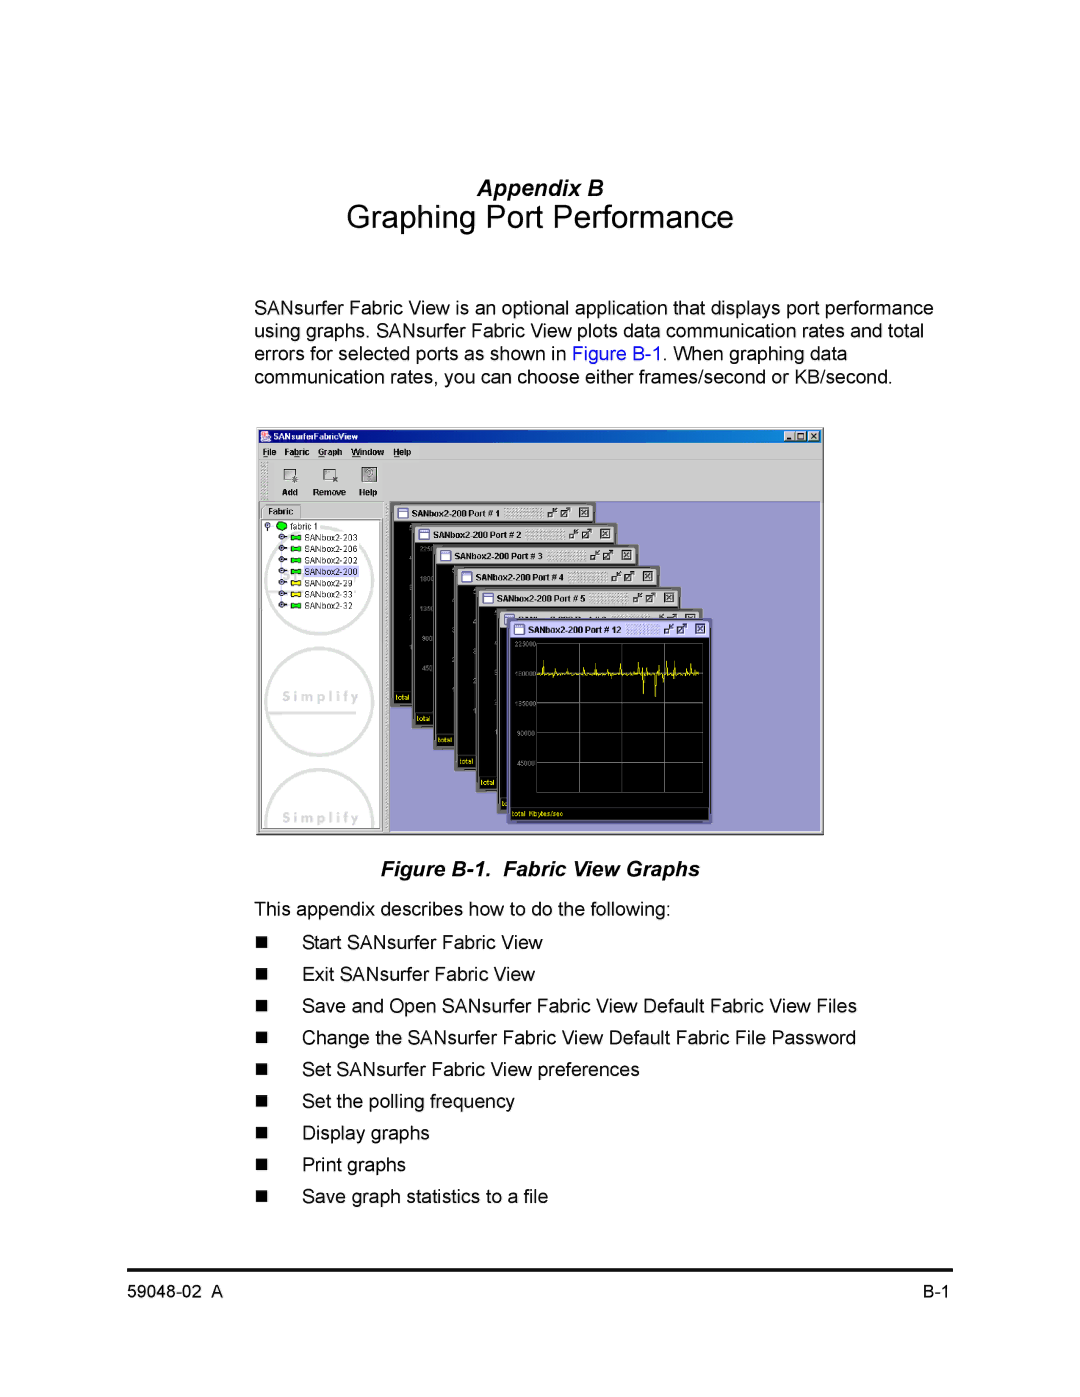
Appendix B Graphing Port Performance
Glossary Index
Printing Graphs Saving Graph Statistics to a File
Severity Levels Edit Zoning Window Tool Bar Buttons
Switch Resets Switch Administrative States Timeout Values
Tables
Menu Shortcut Keys Tool Bar Buttons
Port Administrative States Port Speeds Port Modes
Related Materials
Intended Audience
Contact Information
Technical Support
Availability
Training
Management Workstation Requirements
Installing SANbox Manager
SANsurfer Management Suite Disk Windows Installation
Enter the following command
SANsurfer Management Suite Disk Linux Installation
SANsurfer Management Suite Disk Solaris Installation
SANbox2 Installation Disk Windows Installation
SANbox2 Installation Disk Linux Installation
SANbox2 Installation Disk Solaris Installation
„ For a Linux platform, enter the SANboxManager command
„ For a Solaris platform, enter the SANboxManager command
Starting SANbox Manager
SANbox Manager Window
Exiting SANbox Manager
Save Default Fabric File Dialog SANbox Manager
Uninstalling SANbox Manager
Saving and Opening SANbox Manager Fabric View Files
Changing the SANbox Manager Default Fabric File Password
Preferences Dialog SANbox Manager
Setting SANbox Manager Preferences
Using Online Help
Viewing Software Version and Copyright Information
SANbox Manager User Interface
Menu Bar
Topology Display
Faceplate Display
SANbox Manager Menu Structure
Menu Shortcut Keys
Most menu selections have shortcut keys as shown in Table
Tool Bar Buttons
Tool Bar
Fabric Tree
Fabric Tree
Working Status Indicator
Graphic Window
Data Window and Tabs
Switch and Link Status
Using the Topology Display
Working with Switches and Links
Selecting Switches and Links
Arranging Switches in the Display
Topology Data Windows
Opening the Faceplate Display and Topology Popup Menus
Blades
Using the Faceplate Display
Port Views and Status
Working with I/O Blades and Ports
Selecting I/O Blades and Ports
Faceplate Data Windows
Opening the Faceplate Popup Menu
Security
User Authentication
Inband Management
Inter-Switch Link Security
Managing the Fabric Database
Adding a Fabric
Choose the Add Fabric button
Removing a Fabric
Opening a Fabric View File
Saving a Fabric View File
Rediscovering a Fabric
Adding a New Switch to a Fabric
Replacing a Failed Switch
Deleting Switches and Links
Displaying Fabric Information
Fabric Status
Switch Icon Description
Topology Display Switch and Status Icons
Events Browser
Displaying the Event Browser
Severity Description Icon
Severity Levels
Filter Events Dialog
Filtering the Event Browser
Sorting the Event Browser
Save the Event Browser to a File
Active Zone Set Data Window
Active Zone Set Data Window
Zoning a Fabric
Zoning Concepts
Zones
Soft Zones
Virtual Private Fabric Hard Zones
Access Control List Hard Zones
Aliases
Zone Sets
Zoning Database
Zoning Configuration
Using the Zoning Config Dialog
FC-SW-2 Auto Save
Default Visibility
Restoring Default Zoning
Merging Fabrics and Zoning
Zone Merge Failure
Zone Merge Failure Recovery
Edit Zoning Window
Using the Edit Zoning Window
Edit Zoning Window Tool Bar Buttons
Creating a Zone Set
Managing Zone Sets
Activating and Deactivating a Zone Set
Copying a Zone to a Zone Set
Removing a Zone from a Zone Set or from All Zone Sets
Removing All Zoning Definitions
Removing a Zone Set
Creating a Zone in a Zone Set
Managing Zones
Adding Zone Members
Removing a Zone from All Zone Sets
Renaming a Zone or a Zone Set
Removing a Zone Member
Removing a Zone from a Zone Set
Changing Zone Types
Managing Aliases
Creating an Alias
Removing an Alias from All Zones
Adding a Member to an Alias
Managing Fabrics Zoning a Fabric 59048-02 a
Factory User Accounts
Managing User Accounts
Creating User Accounts
Account Administration Add
Removing a User Account
Account Administration Remove
Account Administration Change Password
Changing a User Account Password
4shows the faceplate display for the SANbox2-64 switch
Displaying Switch Information
Switch Data Window
Name Server Data Window
Name Server Data Window Entries
Switch Data Window Entries
Switch Data Window Entries
Link Data Window
Port Statistics Data Window
Port Information Data Window
Configured Zonesets Data Window
Configured Zonesets Data Window
Alarm Threshold Configuration Dialog
Configuring Alarms
Event
Count
Sample Interval
Exporting Name Server Information to a File
Paging a Switch
Setting the Date and Time
Resetting a Switch
Switch Resets
Configuring a Switch
Switch Properties Dialog
Switch Properties
Domain ID and Domain ID Lock
Symbolic Name
Switch Administrative States
Switch Administrative States
FC-SW-2 Compliance for Zoning
Broadcast Support
Timeout Values
Timeout Values
Legacy Port Address Format
Network Properties Dialog
Network Properties
IP Configuration Parameters
IP Configuration
Snmp Configuration Parameters
Snmp Configuration
Snmp Trap Configuration
Snmp Trap Configuration Parameters
Remote Logging
Archiving a Switch
10. Restore Dialogs Full and Selective
Restoring a Switch
Managing Switches Restoring a Switch
Managing Firmware
Installing Firmware
Changing the Pending Firmware
Restoring the Factory Default Configuration
10. Factory Default Configuration Settings
Activating the Pending Firmware
10. Factory Default Configuration Settings
Blade Information Data Window Entries
Displaying I/O Blade Information
Testing an I/O Blade
Changing the I/O Blade Administrative State
Hot Swap Wizard
Resetting an I/O Blade
Managing I/O Blades Hot Swap Wizard
Displaying Port Information
Managing Ports
Monitoring Port Status
Displaying Port Modes
Port Modes
Port Speeds
Displaying Port Operational States
Displaying Port Speeds
Port Operational States
Displaying Transceiver Media Status
Transceiver Media View
Port Statistics Data Window Entries
LIP ALPD,ALPS
Port Statistics Data Window Entries
Port Information Data Window Entries
Name Server Data Window
Port Properties Dialog
Configuring Ports
Port Administrative States
Changing Port Administrative States
Changing Port Modes
Changing Port Speeds
Changing Buffer-to-Buffer Credits
Stream Guard
Scan Device
Extending Port Credits
Designate Donor Ports
Resetting a Port
Port Loopback Test Dialog
Testing Ports
Managing Ports Testing Ports
Logging On to a Switch
Command Line Interface
Table A-1. Command-Line Completion
Command Syntax
Table A-2. Commands Listed by Authority Level
Commands
Keywords
Admin Command
Authority
Syntax
Authority Admin Syntax alias
Alias Command
Members alias
Remove alias members
Rename aliasold aliasnew
Edit config
Config Command
Syntax config
Keywords activate config
Save config
Restore
Archive function are not compatible with the Config Restore
Command
Ftp get configdata ftp quit
# ftp symbolicname or ipaddress
Date Command
Syntax date
Keywords MMDDhhmmCCYY
Fallback
Fallback Command
Activation. Otherwise, you can use the Reset Switch command
Following is an example of the Fallback command
Syntax
Hardreset Command
Authority User
Help Command
Keywords command
Syntax help command keyword
Authority User Syntax history
History Command
This command clears the event log and all counters
Hotreset Command
Hotreset
Fabric is in the diagnostic operational state
Authority Admin Syntax hotswap
Hotswap Command
To replace? 1,2,3,4,6,7,8,9 1
Unpack file
Image Command
Authority Admin Syntax image cleanup
Keywords cleanup
Syntax lip portnumber Keywords portnumber
Lip Command
Authority Admin
Reinitializes the specified loop port
Syntax passwd accountname Keywords accountname
Passwd Command
Keywords ipaddress
Ping Command
Authority User Syntax Ping
Ipaddress
Displays current system process information
Ps Command
Following is an example of the Ps command
Syntax Examples
Quit Command
Closes the Telnet session
Syntax quit, exit, or logout
Reset Command
Authority Admin Syntax reset
Config configname
Zoning
Table A-3. Switch Configuration Defaults
Table A-4. Port Configuration Defaults
System
Table A-5. Alarm Threshold Configuration Defaults
Table A-7. Snmp Configuration Defaults
Table A-6. Zoning Configuration Defaults
Table A-8. System Configuration Defaults
Syntax set
Set Command
Pagebreak state
Setup option
Switch state
Log option
Port portnumber
Set Config Command
Table A-9. Set Config Port Parameters
Keywords blade slotnumber
Send Arbff True instead of IDLEs
Table A-9. Set Config Port Parameters
Table A-10. Set Config Switch Parameters
Threshold
Table A-11. Set Config Threshold Parameters
Memory. Refer to FC-SW-2 Compliant on
Table A-12. Set Config Zoning Parameters
Press q or qq and the Enter key to do so
Arbff
Following is an example of the Set Config Port command
Following is an example of the Set Config Threshold command
Following is an example of the Set Config Switch command
Following is an example of the Set Config Zoning command
Clear
Set Log Command
Set log
Archive
Port portlist
Level level
Stops logging of events
Save
Start
Stop
Speed transmissionspeed
Set Port Command
Enable
Bypass alpa
Snmp System
Set Setup Command
Set setup
Table A-13. Snmp Configuration Settings
Table A-14. System Configuration Settings
This process before reaching the end of the list
SANbox2 admin # set setup system
Following is an example of the Set Setup System command
Blade
Show Command
Alarm
Keywords about
Ns option
Log option
Table A-15. Show Port Parameters
Pagebreak
Panel
Perf option
LIP Alpd Alps
Support
Post log
Slot slotnumber
Steering domainid
Users
Displays switch operational information
Topology
Displays all connected devices
Following is an example of the Show Domains command
Following is an example of the Show Chassis command
Following is an example of the Show Fabric command
Following is an example of the Show Panel command
Following is an example of the Show NS local domain command
Following is an example of the Show NS domainID command
Following is an example of the Show NS portID command
Following is an example of the Show Interface command
LIPF8F7
Following is an example of the Show Port command
Following is an example of the Show Slot command
Following is an example of the Show Topology command
Following is an example of the Show Switch command
Command Line Interface Show Command
Following is an example of the Show Version command
Show Config Command
Show config
Blade slotnumber
Following is an example of the Show Config Threshold command
Following is an example of the Show Config Switch command
Following is an example of the Show Config Zoning command
Keywords component
Show Log Command
Following is an example of the Show Log command
Following is an example of the Show Log Options command
Show Perf Command
Following is an example of the Show Perf Byte command
Show Setup Command
Show setup
Mfg
Following is an example of the Show Setup Snmp command
Following is an example of the Show Setup System command
Syntax shutdown
Shutdown Command
Status
Test Command
Syntax test
Port portnumber testtype
Test port x internal
Command Line Interface Test Command
Uptime Command
Examples The following is an example of the Uptime command
Authority User Syntax uptime
Add
User Command
Displays all user accounts that exist on the switch
Keywords accounts
Following is an example of the User Add command
Following is an example of the User Delete command
Following is an example of the User List command
Whoami Command
Following is an example of the Whoami command
Whoami
Syntax zone
Zone Command
Type zone zonetype
Members zone
Remove zone members
Rename zoneold zonenew
Following is an example of the Zone Members command
Following is an example of the Zone Zonesets command
Syntax zoneset
Zoneset Command
Rename zonesetold zonesetnew
Following is an example of the Zoneset List command
Delete zoneset
Remove zoneset zonelist
Following is an example of the Zoneset Zones command
Opens a Zoning Edit session
Zoning Command
Keywords active
Edit
Limits
Following is an example of the Zoning Limits command
E2JBOD2
Following is an example of the Zoning List command
Command Line Interface Zoning Command
Graphing Port Performance
Exiting SANsurfer Fabric View
Starting SANsurfer Fabric View
Saving and Opening SANsurfer Fabric View Fabric View Files
Figure B-3. Load Default Fabric File SANsurfer Fabric View
Figure B-5. Preferences SANsurfer Fabric View
Setting SANsurfer Fabric View Preferences
Displaying Graphs
Setting the Polling Frequency
Customizing Graphs
Arranging Graphs in the Display
Printing Graphs
Saving Graph Statistics to a File
Class 2 Service
Access Control List Zone
Administrative State
BootP
Fabric Management Switch
Class 3 Service
Configured Zone Sets
Default Visibility
Output Power LED
Input Power LED
Inter-Switch Link
Maintenance Mode
Private Loop
Power On Self Test Post
Principal Switch
Private Device
Index
Index-2 59048-02 a
59048-02 a Index-3
Index-4 59048-02 a
59048-02 a Index-5
Index-6 59048-02 a
59048-02 a Index-7
SANbox2-64 Switch Management User’s Guide Index-8 59048-02 a