Charts with Two Variables
Create a new Data & Statistics page.
Notice both axes are marked Click to add variable.
As before select mshoe for the horizontal axis.
Move the cursor to the left edge of the screen, click x and select the variable mhand for the vertical axis.
This displays the scatterplot.
First Steps with
Tutorial 7: One- and
Ready to add a 2nd variable
It may be that there is a positive correlation and a relationship between hand span and shoe size, so it may be appropriate to model this relationship with a linear function. The Analyze menu provides a range of tools to use.
Fitting a Line by Hand and Eye
First try adding a line of best fit by eye, using option
2:Add Movable Line. This displays a straight line together with a functional relationship between mshoe and mhand. The line can be dragged into a
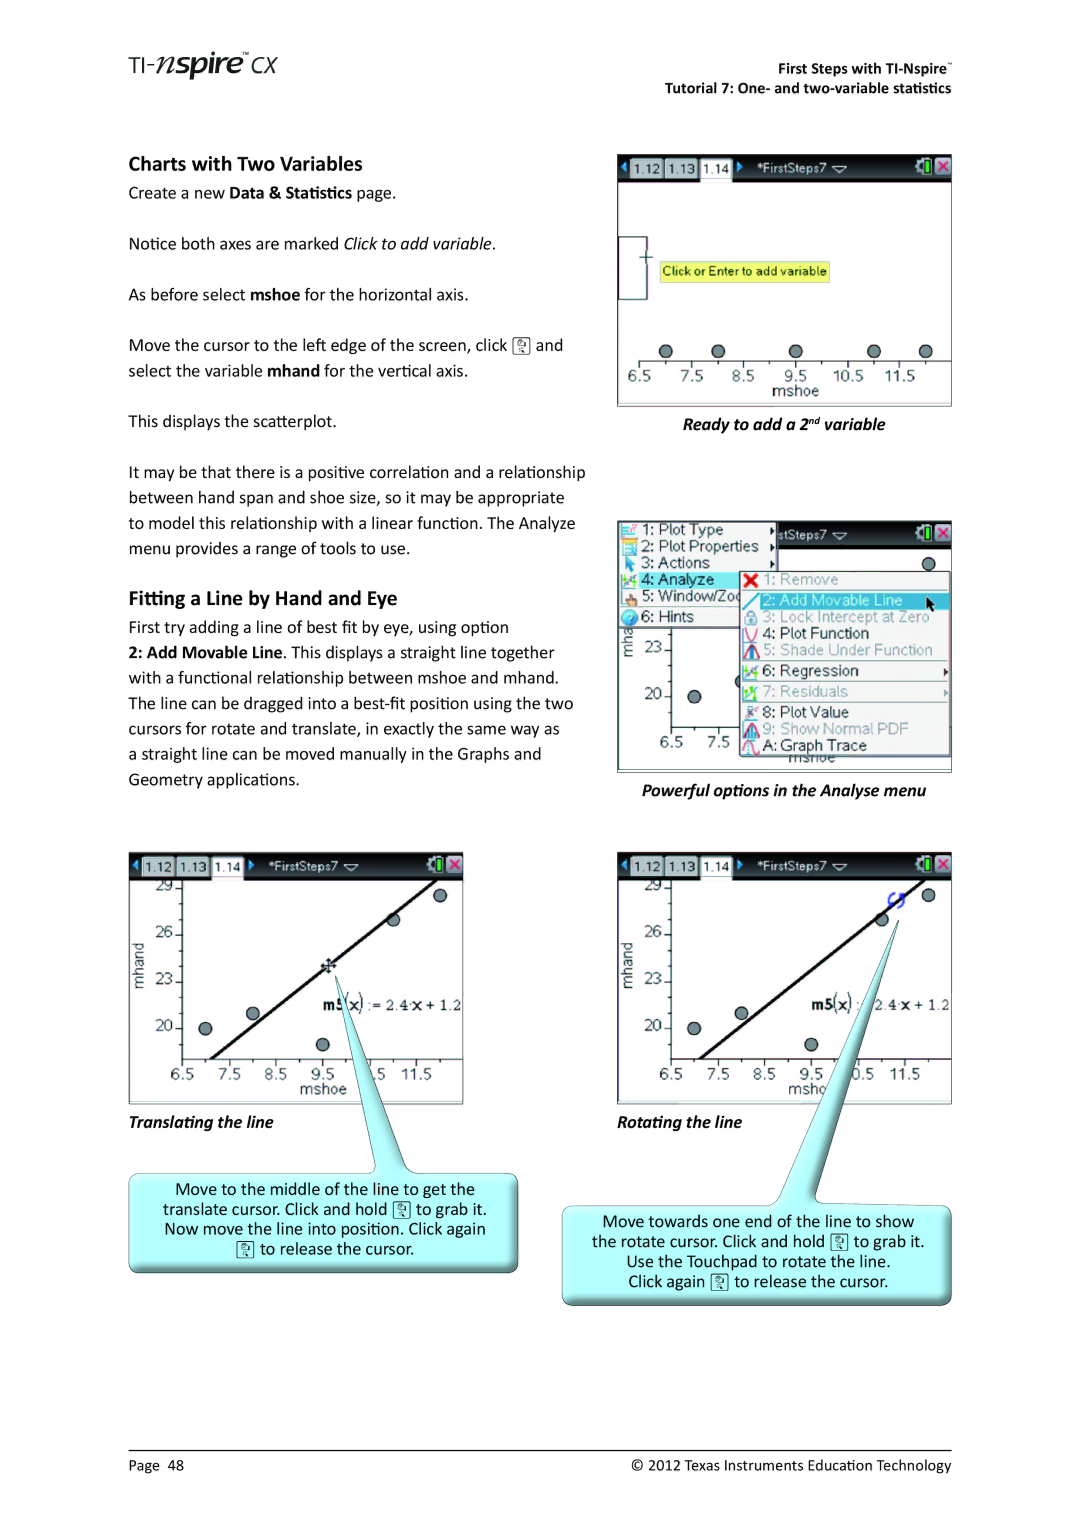
Translating the line
Powerful options in the Analyse menu
Rotating the line
Move to the middle of the line to get the translate cursor. Click and hold x to grab it. Now move the line into position. Click again x to release the cursor.
Move towards one end of the line to show the rotate cursor. Click and hold x to grab it. Use the Touchpad to rotate the line.
Click again x to release the cursor.
Page 48 | © 2012 Texas Instruments Education Technology |