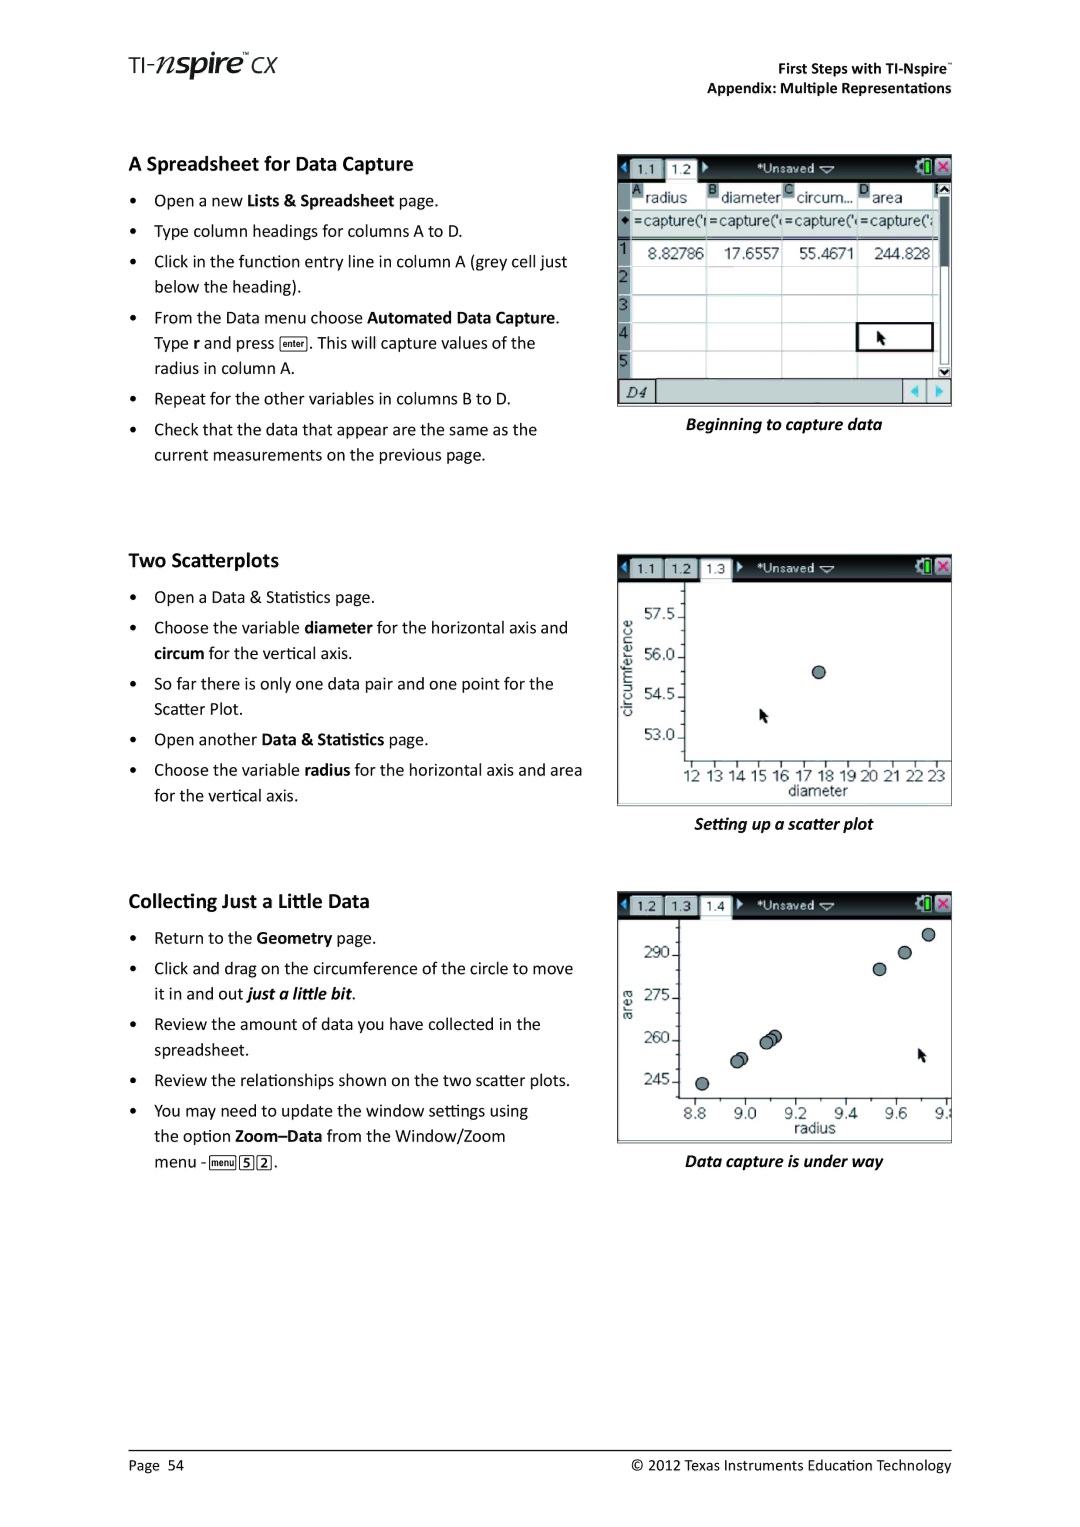
A Spreadsheet for Data Capture
•Open a new Lists & Spreadsheet page.
•Type column headings for columns A to D.
•Click in the function entry line in column A (grey cell just below the heading).
•From the Data menu choose Automated Data Capture. Type r and press ·. This will capture values of the radius in column A.
•Repeat for the other variables in columns B to D.
•Check that the data that appear are the same as the current measurements on the previous page.
First Steps with
Appendix: Multiple Representations
Beginning to capture data
Two Scatterplots
•Open a Data & Statistics page.
•Choose the variable diameter for the horizontal axis and circum for the vertical axis.
•So far there is only one data pair and one point for the Scatter Plot.
•Open another Data & Statistics page.
•Choose the variable radius for the horizontal axis and area for the vertical axis.
Collecting Just a Little Data
•Return to the Geometry page.
•Click and drag on the circumference of the circle to move it in and out just a little bit.
•Review the amount of data you have collected in the spreadsheet.
•Review the relationships shown on the two scatter plots.
•You may need to update the window settings using the option
Setting up a scatter plot
Data capture is under way
Page 54 | © 2012 Texas Instruments Education Technology |