First Steps with
Tutorial 6: Lists & Spreadsheet
Frequency Charts
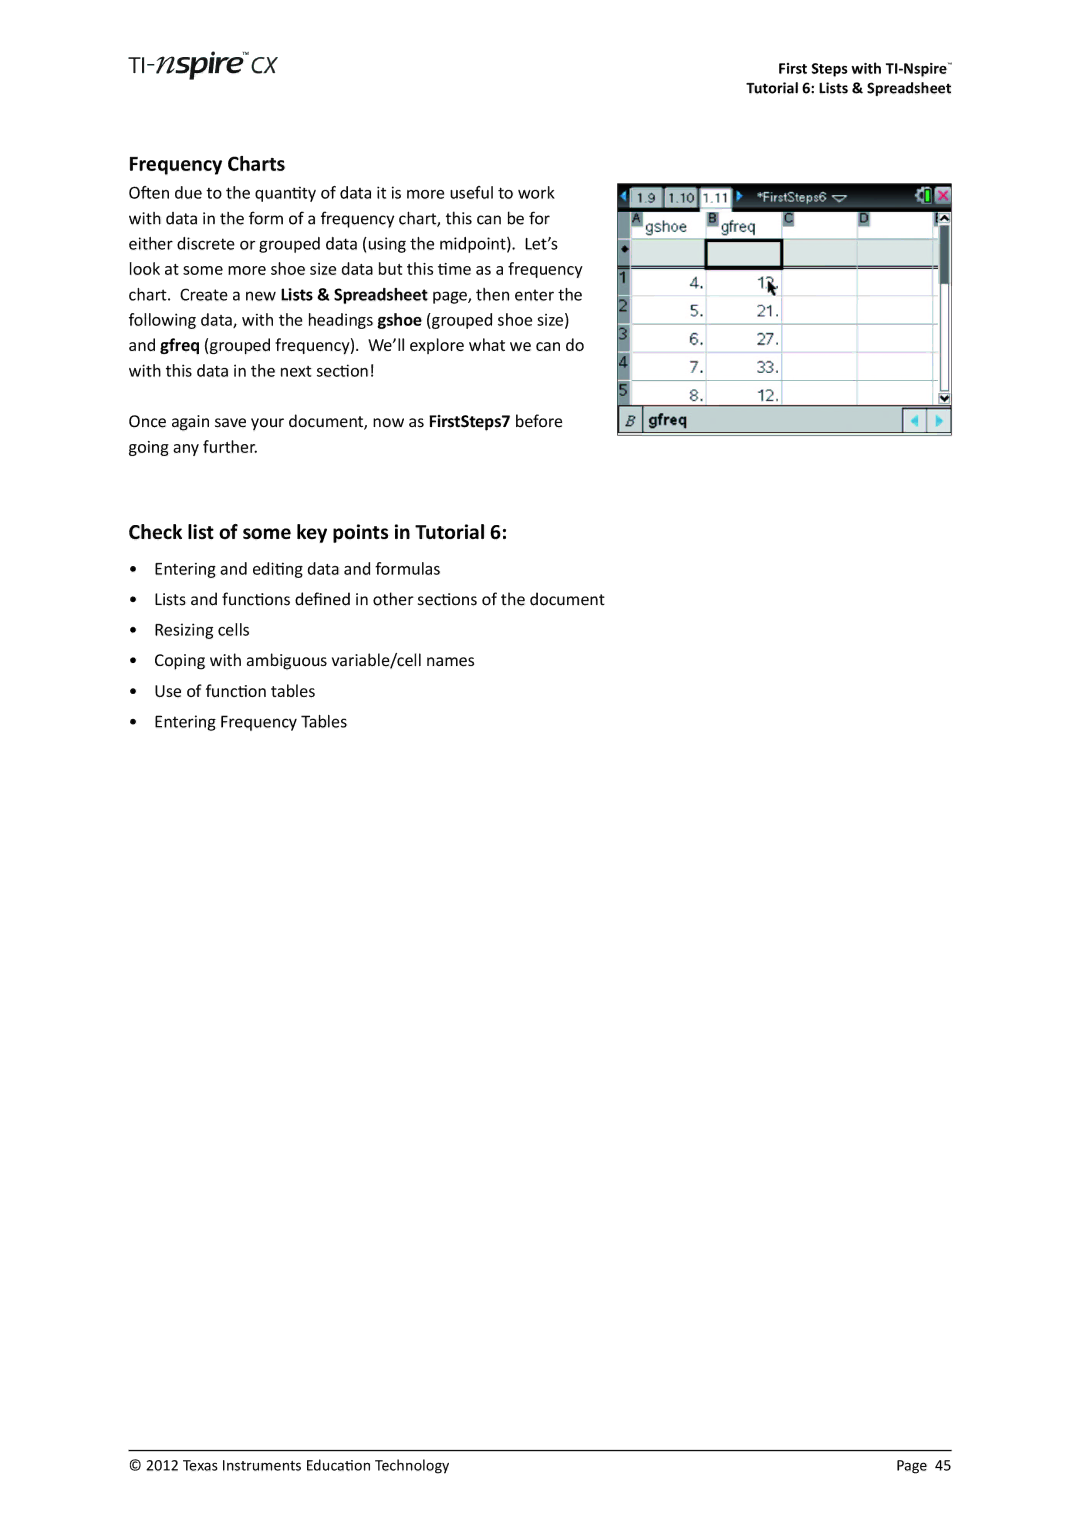
Often due to the quantity of data it is more useful to work with data in the form of a frequency chart, this can be for either discrete or grouped data (using the midpoint). Let’s look at some more shoe size data but this time as a frequency chart. Create a new Lists & Spreadsheet page, then enter the following data, with the headings gshoe (grouped shoe size) and gfreq (grouped frequency). We’ll explore what we can do with this data in the next section!
Once again save your document, now as FirstSteps7 before going any further.
Check list of some key points in Tutorial 6:
•Entering and editing data and formulas
•Lists and functions defined in other sections of the document
•Resizing cells
•Coping with ambiguous variable/cell names
•Use of function tables
•Entering Frequency Tables
© 2012 Texas Instruments Education Technology | Page 45 |