A Different Approach to Scatterplots
•Open a new Graphs page.
•From the Graph Type menu choose Scatter Plot – b34.
•Set x to be radius and y to be area.
•From the Window menu choose
•Now choose Function from the Graph Type menu - b31.
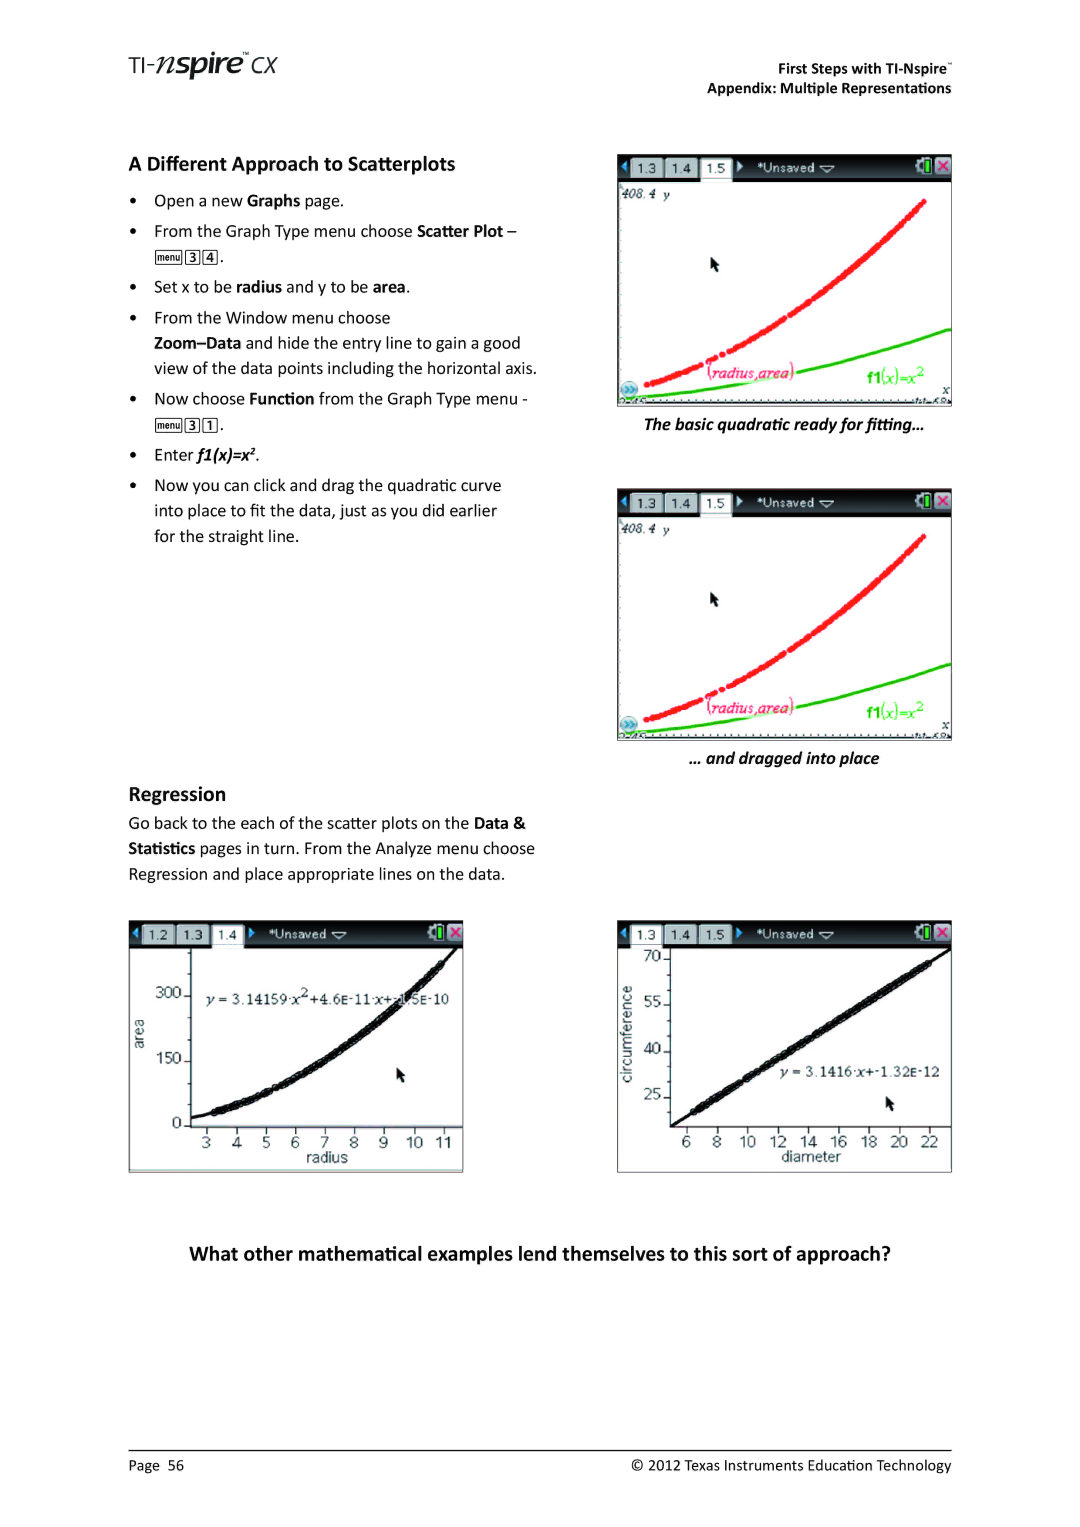
•Enter f1(x)=x2.
•Now you can click and drag the quadratic curve into place to fit the data, just as you did earlier for the straight line.
Regression
Go back to the each of the scatter plots on the Data & Statistics pages in turn. From the Analyze menu choose Regression and place appropriate lines on the data.
First Steps with
Appendix: Multiple Representations
The basic quadratic ready for fitting…
… and dragged into place
What other mathematical examples lend themselves to this sort of approach?
Page 56 | © 2012 Texas Instruments Education Technology |