First Steps with
Tutorial 7: One- and
Tutorial 7
One and Two Variable Statistics
One of the six core applications of
Shoe Sizes and Hand Spans
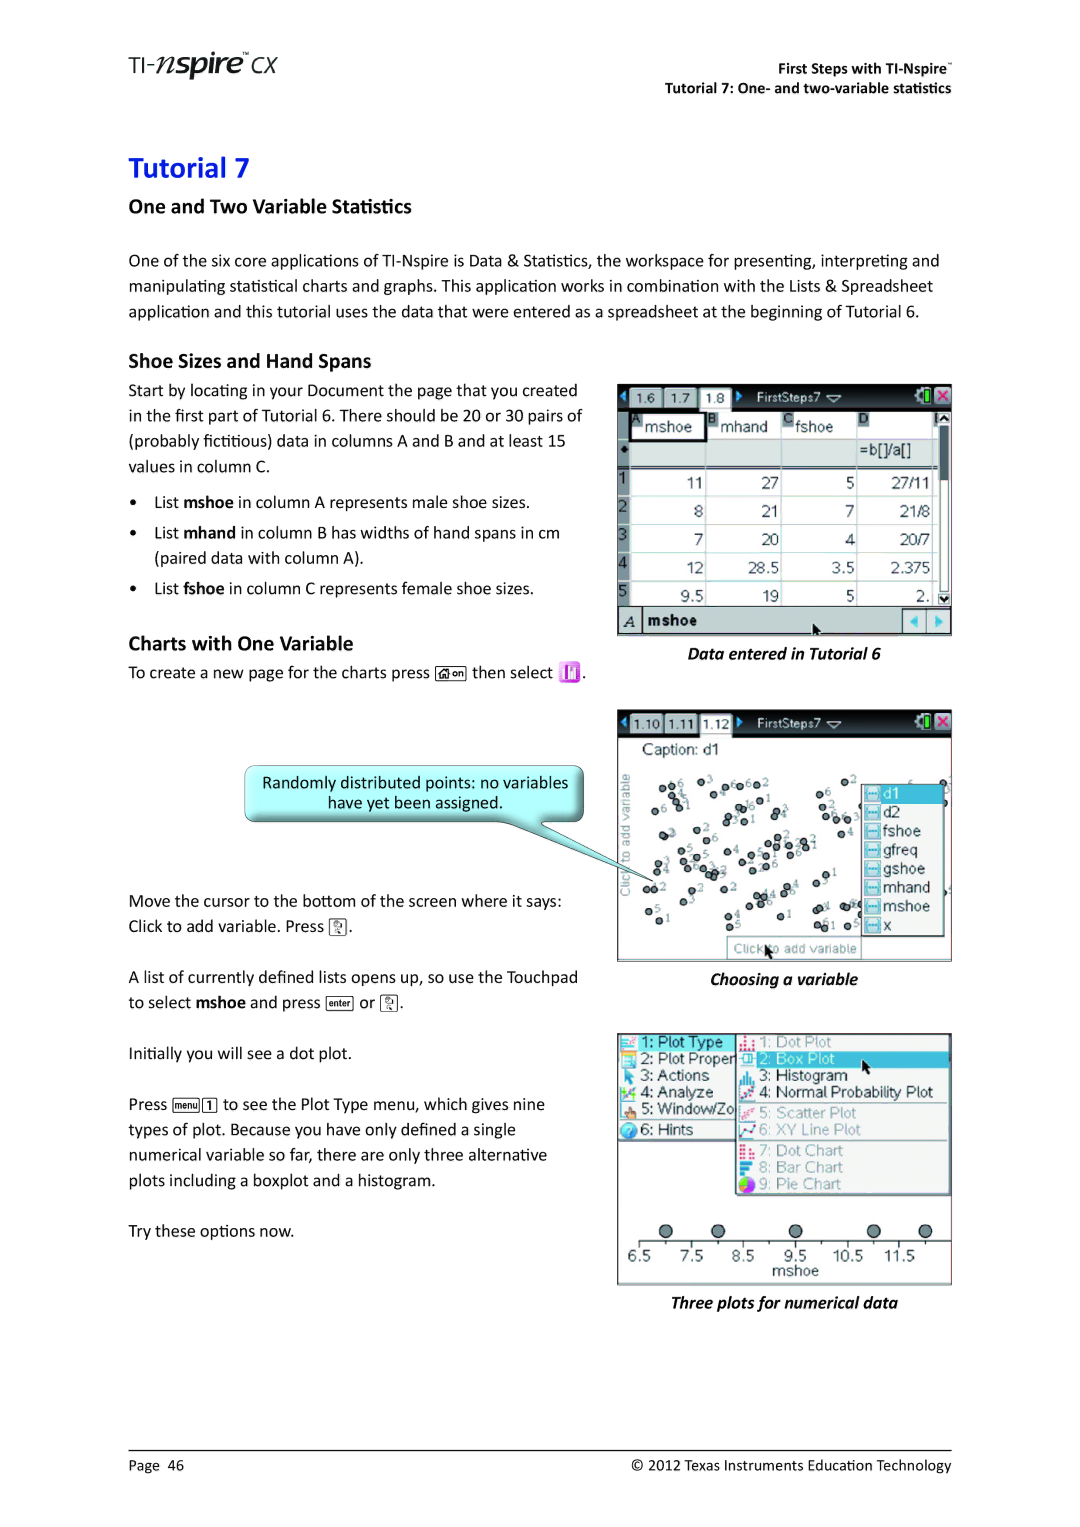
Start by locating in your Document the page that you created in the first part of Tutorial 6. There should be 20 or 30 pairs of (probably fictitious) data in columns A and B and at least 15 values in column C.
•List mshoe in column A represents male shoe sizes.
•List mhand in column B has widths of hand spans in cm (paired data with column A).
•List fshoe in column C represents female shoe sizes.
Charts with One Variable
To create a new page for the charts press c then select ![]() .
.
Randomly distributed points: no variables
have yet been assigned.
Move the cursor to the bottom of the screen where it says: Click to add variable. Press x.
A list of currently defined lists opens up, so use the Touchpad to select mshoe and press · or x.
Initially you will see a dot plot.
Press b1 to see the Plot Type menu, which gives nine types of plot. Because you have only defined a single numerical variable so far, there are only three alternative plots including a boxplot and a histogram.
Try these options now.
Data entered in Tutorial 6
Choosing a variable
Three plots for numerical data
Page 46 | © 2012 Texas Instruments Education Technology |