5.2 Statistics
The storage administrator can monitor important statistics that define the level of system performance through the various management utilities. These statistics include Input and Output operations per second (IOPS) and bandwidth.
5.2.1Viewing IO/Second Summary Via Web Interface
•Click on one of the “Fibre Channel” graphics or the “Management Control Processor” graphic
•Click on the “Statistics” tab
•Click the radio button next to “IOps”
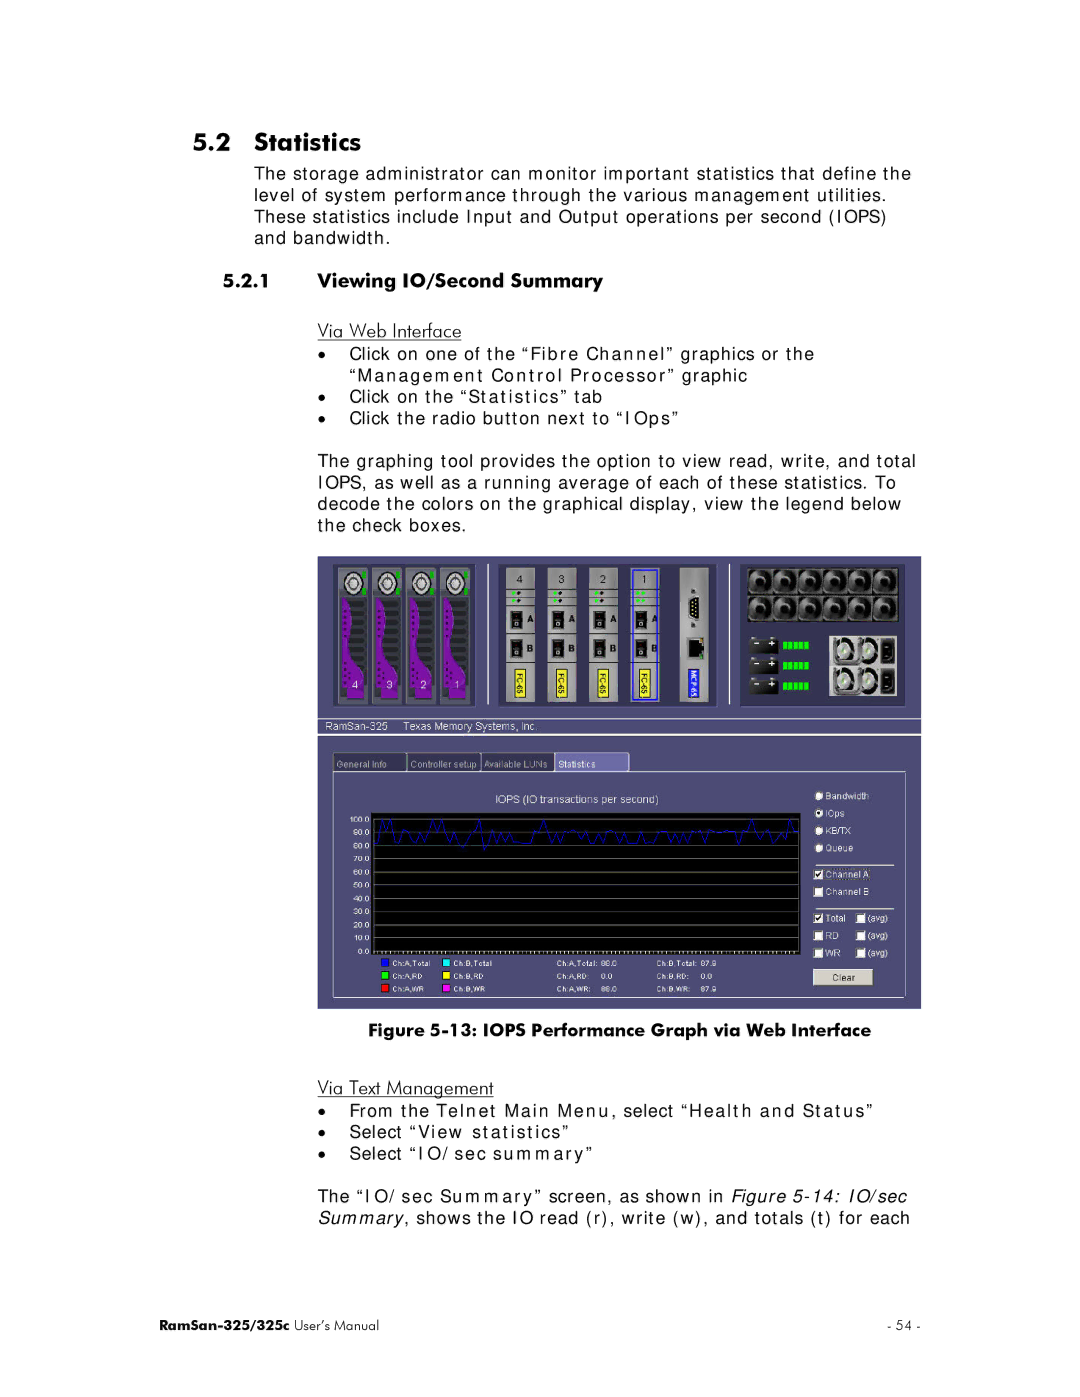
The graphing tool provides the option to view read, write, and total IOPS, as well as a running average of each of these statistics. To decode the colors on the graphical display, view the legend below the check boxes.
Figure 5-13: IOPS Performance Graph via Web Interface
Via Text Management
•From the Telnet Main Menu, select “Health and Status”
•Select “View statistics”
•Select “IO/sec summary”
The “IO/sec Summary” screen, as shown in Figure
| - 54 - |