Firmware Version 1.30 User’s Guide
W . d e l l . c o m s u p p o r t . d e l l . c o m
May
Contents
Viewing Localized Versions of the Web-Based Interface
Configuring the Drac 4 Network Settings
Configuring Red Hat Enterprise Linux for
Removing Drac 4-Related Applications and Drivers
Enabling Microsoft Telnet for Telnet Console Redirection
Configuring Red Hat Enterprise Linux Minicom for
Adding and Configuring Drac 4 Users and Alerts
First Steps to Troubleshoot a Remote System
Configuring the Drac 4 Active Directory Settings
Configuring Active Directory to Access Your Drac
Installing the Dell Extension to the Active Directory Users
Using Active Directory to Log In To the Drac 100
Viewing a List of Serial/Telnet Commands 128
Installing Operating Systems Using Virtual Media 114
Enabling and Disabling the Virtual Media Feature 115
111
134
Using the racadm Utility to Configure the Drac 137
Creating Bootable Deployment Image Files 146
136
153
151
152
154
166
164
165
167
174
172
173
175
180
178
179
181
197
190
194
199
200
CfgNetTuningNicAutoneg Read/Write 204
CfgNetTuningNicFullDuplex Read/Write 205
203
218
214
217
219
Management Station COM Port Settings
Setting Up Active Directory Objects
Drac 4 Power Requirements
Overall Architecture of Virtual Media 111
Watchdog Information Fields
Enable email Alert Properties
Certificate Signing Request Generation
Last Crash Screen Page Buttons
List of Attributes Added to
Drac 4 Network Error Codes
DellAssociationObject Class
Log/Verbose Level Options 131
Table A-10 Fwupdate Subcommand Options 157 Table A-11
Table A-5 Config Subcommand Options
Table A-6 Getconfig Subcommand Options 152 Table A-7
Table A-12 Getssinfo Subcommand Options 159 Table A-13
Table A-35 Sslcsrgen Subcommand Options 175 Table A-36
Table A-28 Serveraction Subcommand Options 169 Table A-29
Table A-33 Setrac Subcommand Options 173 Table A-34
Table A-41 Sslcertview Subcommand Options 178 Table A-42
What’s New in Drac 4 in this Release?
Drac 4 Overview
Drac 4 Hardware Features
Drac 4/I Hardware Features RJ-45 Connector
Connectors
Hardware Specifications
Power Requirements
Lists the power requirements for the Drac
Lists the features of each type of connection
Supported Remote Access Connections
Drac 4 Security Features
Supported Web Browsers
Supported Platforms
Supported Operating Systems
Features
Other Documents You May Need
Drac 4 Overview
Installing and Setting Up the Drac
Installing the Drac 4 Hardware
Software Installation and Configuration Overview
What You Need to Get Started
Installing the Software on the Managed System
Disabling the Windows Automatic Reboot Option
Mount /mnt/cdrom Cd /mnt/cdrom Rpm -ivh linux/rac/*.rpm
Installing the Software on the Management Station
Configuring a Supported Web Browser
Rpm -e racadm
Installing the Sun Java Plug-In to Use Mozilla
Installing the Sun Java Plug-In
Installing the Sun Java Plug-In to Use Console Redirection
Viewing Localized Versions of the Web-Based Interface
For example
Configuring Drac 4 Properties
Rpm -iv j2re-14versionnumber-linux-i586.rpm
Register the Java plug-in
Configuring the Drac 4 Network Settings
Configuring the Drac 4 Network Settings Using the Option ROM
Waiting for response from Dhcp Server
Virtual Media Configuration Options
Adding and Configuring Drac 4 Users
Adding and Configuring Snmp Alerts
Clearing the Web Browser Cache With Mozilla
Updating the Drac 4 Firmware
Clearing the Web Browser Cache With Internet Explorer
Accessing the Drac 4 Through a Network
Drac 4 Software Basics for Red Hat Enterprise Linux
Service racsvc status
Where action is start, stop, status, or probe
Removing Drac 4-Related Applications and Drivers
Additional Information
Removing the Drac
Serial and Telnet Console Features
Drac 4 NIC
Configuring the System Setup Program on the Managed System
F2 = System Setup
Kernel ............. console=ttyS0,57600
Serial --unit=0 --speed=57600 terminal --timeout=10 serial
Append two options to the kernel line
Sample File /etc/innitab
Enabling Login to the Console After Boot
Co2345respawn/sbin/agetty -h -L 57600 ttyS0 vt100
TtyS0
Enabling the Serial/Telnet Console on the Drac
Using racadm Remotely
Racadm config -g group -o object value
Racadm getconfig -g group
Racadm config -g cfgSerial -o cfgSerialSshEnable
Using the Secure Shell SSH
Racadm getconfig -g cfgSerial
AES128-CBC
You can change the SSH port with the command
AES192-CBC
3DES-192-CBC
Connecting the DB-9 Cable
Required Pinout for DB-9 Null Modem Cable Signal Name
Page
Type minicom -c on
Configuring HyperTerminal for Serial Console Redirection
Clear the init, reset, connect, and hangup
Page
Using a Serial or Telnet Console
Enabling Microsoft Telnet for Telnet Console Redirection
Logging
Accessing the Web-Based Interface
Managing and Recovering a Remote System
Password
Adding and Configuring Drac 4 Users and Alerts
Adding and Configuring Drac 4 Users
User Properties Property Description User Name
Configuring User email Alerts
Use the information in -3 to enable email alerts
Severe
Go Back To User Configuration
Email Alert Severity Description Informational
Alert Description
Configuring the Drac 4 NIC
Check box is selected Default Smtp Email Server
Duplex Mode
Email Alert Settings
Drac 4 Network Configuration Page Buttons
Adding and Configuring Snmp Alerts
Configuring Alerts by Severity
Such as chassis intrusion
Severity Options Description Informational
System Fan Sensors Monitors the system fan speed RPM
10. Snmp Alerts Page Buttons Action Print
Managing a Remote System
Snmp Alert Properties PropertyDescription
Updating the Drac 4 Firmware
Ensuring Drac 4 Network Security
Serial
Issuer
Type
Key Size
Upload Certificate
Default certificate you received with your Drac
From the CA
View Server Certificate
Management Generate
14. Required CSR Fields Properties Description Locality L
State S
16. Certificate Management Page Buttons Action Print
Viewing System Information
Server Address
Bios Version
Service Tag
System Information
Recovering and Troubleshooting the Managed System
Managing Power on a Remote System
First Steps to Troubleshoot a Remote System
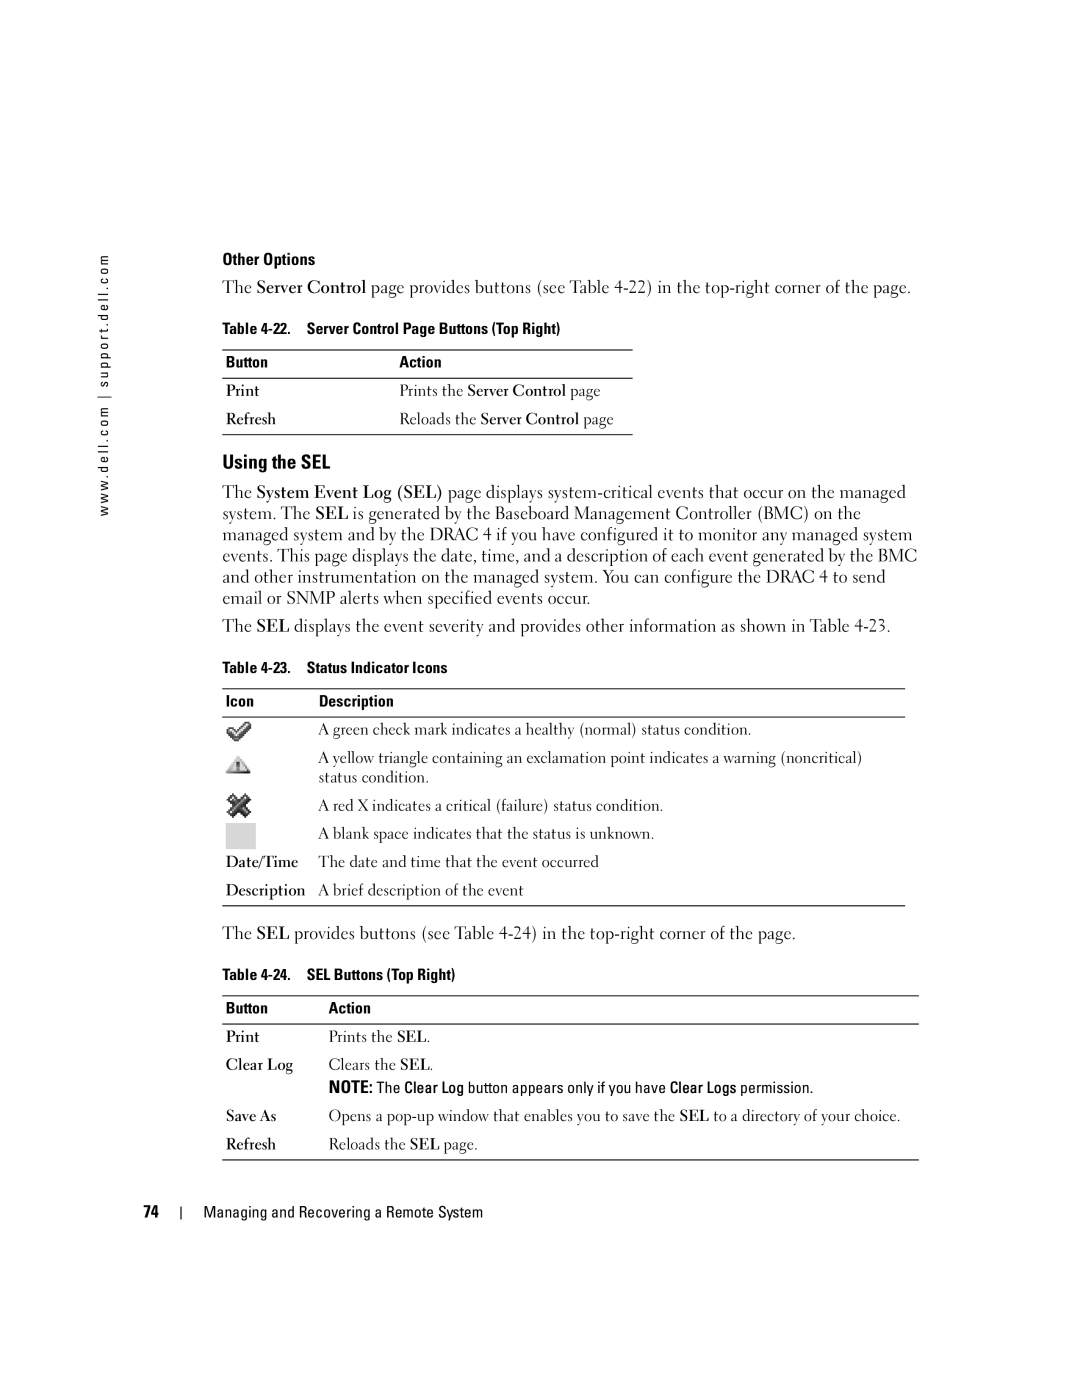
Using the SEL
SEL provides buttons see -24 in the top-right corner
Date/ Time
Using the Drac 4 Log
25. Status Indicator Icons Description
User
Using the Diagnostic Console
Viewing the Last System Crash Screen
Netstat
28. Diagnostic Commands Description Arp
Ifconfig
Ping IP Address
Troubleshooting Network Problems
30. Drac 4 Network Error Codes Description
Troubleshooting Alerting Problems
RAC189A
RAC065A
Frequently Asked Questions
Managing and Recovering a Remote System
Managing and Recovering a Remote System
Active Directory Schema Extensions
Using the Drac 4 With Microsoft Active Directory
Overview of the RAC Schema Extensions
Active Directory Object Overview
RAC4 Privilege Object
Group1 Priv1
User1 User2 User3
AO1
Using the Dell Schema Extender
Configuring Active Directory to Access Your Drac
Extending the Active Directory Schema
Click Next to run the Dell Schema Extender Click Finish
840.113556.1.8000.1280.1.1.1.4 Description
DellRAC4Privileges Class
840.113556.1.8000.1280.1.1.1.3 Description
Attributes DellRAC4Privileges DellProduct Class
DelIsLogClearAdmin
False
Ldaptypecaseignorestring
Creating a RAC Device Object
Adding Drac 4 Users and Privileges to Active Directory
Opening the Active Directory Users and Computers Snap-In
Creating a Privilege Object
Select the scope for the Association Object Click OK
Creating an Association Object
Adding Objects to an Association Object
Enabling SSL on a Domain Controller
Click Next and click Finish
Click Finish and click OK
Exporting the Domain Controller Root CA Certificate
Select Computer account and click Next
Configuring the Drac
Click the Configuration tab and select Network
100
Using Active Directory to Log In To the Drac
Racadm config -g cfgLanNetworking -o cfgDNSServersFromDHCP
Lists frequently asked questions and answers
101
Racadm sslcertupload -t 0x1 -f websslcert
102
103
Using Console Redirection
Overview
Maximum console redirection sessions
Current console redirection sessions
105
Running the racadm racreset hard command
Using Console Redirection Frequently Asked Questions Answer
Racadm racreset command
106
107
108
109
Run Xconfigurator if not previously run before
Rpm -qa grep radeon7000mdellserver
Run Xwindows startx
110
111
Overall Architecture of Virtual Media Managed System
Operating System Requirements on the Managed System
113
Installing the Virtual Media Plug-In
Using the Virtual Media Feature
Booting From the Virtual Media
Installing Operating Systems Using Virtual Media
Cat /var/log/messages grep Virtual
Enabling and Disabling the Virtual Media Feature
Racadm config -g cfgRacVirtual -o cfgVirMediaDisable
115
Racadm config -g cfgRacVirtual -o cfgFloppyEmulation
Configuring the Virtual Floppy Feature as a Super Floppy
Configuring the Virtual Floppy as a Hard Drive
DELL-VIRTUALS-120 Removable Media Drive
Execution Environment
Installation
Racvmcli
117
Racvmcli parameters OS-shell options
Interfaces and APIs
VM-CLI Parameters
Drac 4 IP Address
UDRAC-user-name
119
CD/DVD Device or Image File
Cdevice-name image-file
121
Detect Virtual device
Racadm getconfig -g
Drive Number 0 failed to
Drive Number 1 failed to CfgRacVirtual
Messages
Use the racadm vmdisconnect command to
Other console startup
123
Drive Number 1 Virtualcdrom
Drive Number 0 Virtualfloppy
Drive Removable Media Drive
124
125
Mount /mnt/cdrom1
Cat /var/log/messages grep
Cat /etc/fstab grep /dev/hde
126
127
Logging into the Drac
Starting a Text Console
Setsvctag Firmware Unsupported Command
Viewing a List of Serial/Telnet Commands
Racadm config -g cfgSerial -o cfgSerialHistorySize number
128
Prompt a racadm help more
Using the racadm CLI
Racadm Command Description
129
Racadm Synopsis
Using the racadm CLI Remotely
Lists the options for the racadm command
Racadm Options
131
Type the following command to disable the remote capability
Racadm Command Options
Option Description
Racadm Subcommand Descriptions
132
Configuration File Overview
Configuring Multiple Drac 4s
Racadm Error Messages
133
Creating a Drac 4 Configuration File
Racadm getconfig -f myfile.cfg
See the example in the previous bullet
Use the racresetcfg subcommand to keep all Drac 4s the same
CfgLanNetworking CfgNicIpAddress=143.154.133.121
135
Racadm getconfig -g groupName -i index
Configuration File Example
Racadm config -g groupName -o objectName -i index
136
This file will be updated as follows
Using the racadm Utility to Configure the Drac
File contents are as follows
137
# cfgUserAdminIndex=XX CfgUserAdminUserName=
Racadm getconfig -u username
Racadm getconfig -g cfgUserAdmin -i index
Before Adding a Drac 4 User
Specific object
Adding a Drac 4 User With Alerting Capabilities
139
Adding a Drac 4 User With Permissions
140
141
Configuring Drac 4 Network Properties
Racadm getconfig -g cfgLanNetworking
Racadm subcmd Firmware Error message
Racadm subcmd Error message
Racadm subcmd Transport Error message
142
Requirements
143
Tasks
Vmdeploy
145
Linux Users
Creating Bootable Deployment Image Files
To create image files from existing bootable media
Windows Users
147
Troubleshooting the Drac
Troubleshooting
Troubleshooting
Synopsis
Racadm help Racadm help subcommand
Help
Description
Clearasrscreen
Config/getconfig
Arp
Racadm arp
Racadm getconfig Filename
Config Subcommand Description
Racadm config -p -c -f filename Racadm config -g
Racadm Getconfig
Filename command
Getconfig Subcommand Description
Table A-6. getconfig Subcommand Options Description
152
Examples
Table A-7 describes the coredump subcommand
Coredump
Racadm coredump
Output Example
154
Current task stack Ipev -#005e0000 binary data
Fwupdate
Coredumpdelete
FW dcmdCoreDump No Core dump available
Table A-9. fwupdate Subcommand Definition
Load the update file into the Drac 4 RAMdisk area
Table A-10 describes the fwupdate subcommand options 156
Input
Table A-10. fwupdate Subcommand Options Description
157
158
Racadm -r Racip -u user -p password fwupdate -g -u -a
Updating the Firmware
Getssninfo
Table A-11 describes the getssinfo subcommand
Table A-12 describes the getssinfo subcommand options
Racadm getssninfo -A -u username
Root Thu 06 Mar
Getsysinfo
Web
143.166.174.19 2004 103239 GMT-0600
Following data element is output as a string
Table A-15 describes the getsysinfo subcommand options
Watchdog information/recovery action
161
Racadm getsysinfo -w -s
Restrictions
Racadm getsysinfo -A -w -s
Getractime
Ifconfig
Racadm ifconfig
Racadm getractime -u -d
Setniccfg/getniccfg
Netstat
Ping
Racadm ping ipaddress
Description for getniccfg
Table A-21. setniccfg/getniccfg Subcommand Definition
Description for setniccfg
165
Example
Getsvctag
Racdump
Racadm getsvctag
Racadm racreset hard soft graceful delay in seconds
Racreset
Transport Error RC=-1
Table A-26 describes the racresetcfg subcommand
Racresetcfg
Table A-25 describes the racreset subcommand options
Racadm racresetcfg
Table A-27. serveraction SubcommandDefinition
Table A-27 describes the serveraction subcommand
Racadm serveraction -d delay action
Serveraction
Table A-29 Getraclog Command Definition
Serveraction command returns without output if successful
Table A-29 describes the getraclog command
Getraclog
Getsel
Table A-30 describes the getsel command
Clrraclog
Racadm clrraclog
Racadm clrsel
Clrsel
Gettracelog
Racadm gettracelog Racadm gettracelog -m
Setrac
Racadm setrac -h -o -T -d
Table A-34. sslcsrgen SubcommandDescription
Table A-34 describes the sslcsrgen subcommand
Table A-33. setrac Subcommand Options
Sslcsrgen
Options
Table A-35 describes the sslcsrgen subcommand options
Table A-35. sslcsrgen Subcommand Options Description
175
Racadm sslcertupload -t 0x1 -f c\cert\cert.txt
Sslcertupload
Racadm sslcertupload -t type -f filename
Racadm sslcertdownload -t 0x1 -f c\cert\cert.txt
Sslcertdownload
Racadm sslcertdownload -t type -f filename
Racadm sslcertview -t type -A
Sslcertview
Output Examples
Round Rock Texas john@dell.com
1024 DSU+123431 DSU+153431 RMC Default Certificate Dell Inc
Testemail
Racadm testemail -i index -u username
Testtrap
Racadm testtrap -i index
Vmdisconnect
Table A-46 describes the vmdisconnect subcommand
Table A-46. vmdisconnect Subcommand Description
Racadm vmdisconnect
Racadm Subcommand Man Pages
IdRacDescriptionInfo Read Only
IdRacInfo
IdRacProductInfo Read Only
IdRacMisc Read/Write
IdRacVersionInfo Read Only
IdRacName Read/Write
CfgDNSDomainNameFromDHCP Read/Write
CfgLanNetworking
IdRacType Read
CfgDNSDomainName Read/Write
CfgDNSRacName Read/Write
CfgDNSRegisterRac Read/Write
CfgDNSServer2 Read/Write
CfgDNSServersFromDHCP Read/Write
CfgDNSServer1 Read/Write
187
CfgNicNetmask Read/Write
CfgNicEnable Read/Write
CfgNicIpAddress Read/Write
CfgNicUseDhcp Read/Write
CfgCurrentLanNetworking
CfgNicGateway Read/Write
CfgNicMacAddress Read Only
CfgNicCurrentGateway Read Only
CfgNicCurrentIpAddress Read Only
CfgNicCurrentNetmask Read Only
CfgNicCurrentDhcpWasUsed Read Only
CfgDNSCurrentDomainName Read Only
CfgRhostsSmtpEmailEnable Read/Write
CfgRemoteHosts
CfgDNSCurrentServer1 Read Only
CfgRhostsSmtpServerIpAddr Read/Write
CfgRhostsFwUpdateTftpEnable Read/Write
CfgRhostsFwUpdateIpAddr Read/Write
CfgUserAdminPrivilege Read/Write
CfgUserAdmin
CfgRhostsFwUpdatePath Read/Write
Legal Values
Table B-1. Bit Masks for User Privileges
CfgUserAdminUserName Read/Write
CfgUserAdminPassword Write Only
CfgUserAdminEmailEnable Read/Write
CfgUserAdminAlertFilterRacEventMask Read/Write
CfgUserAdminAlertFilterSysEventMask Read/Write
195
CfgUserAdminIndex Read Only
CfgUserAdminEmailAddress Read/Write
CfgUserAdminEmailCustomMsg Read/Write
CfgTraps
CfgTrapsFilterRacEventMask Read/Write
CfgTrapsEnable Read/Write
CfgTrapsSnmpCommunity Read/Write
197
CfgTrapsIndex Read Only
CfgSessionManagement
CfgTrapsFilterSysEventMask Read/Write
CfgSsnMgtMaxSessionsPerUser Read/Write
CfgSsnMgtSshIdleTimeout Read/Write
CfgSsnMgtMaxSessions Read/Write
199
CfgSerialBaudRate Read/Write
CfgSerialConsoleEnable Read/Write
CfgSerial
CfgSerialConsoleShellType Read/Write
CfgSerialConsoleIdleTimeout Read/Write
CfgSerialConsoleQuitKey Read/Write
201
CfgSerialHistorySize Read/Write
CfgSerialConsoleCommand Read/Write
CfgSerialConsoleNoAuth Read/Write
CfgSerialCom2RedirEnable Read/Write
CfgSerialSshEnable Read/Write
CfgSerialTelnetEnable Read/Write
203
CfgNetTuningNic100MB Read/Write
CfgNetTuning
CfgNetTuningNicAutoneg Read/Write
CfgSerialTelnet7flsBackspace Read/Write
CfgNetTuningIpTtl Read/Write
CfgNetTuningNicFullDuplex Read/Write
CfgNetTuningNicMtu Read/Write
Legal Values Integer from 1 to Default 0x40
CfgNetTuningTcpSrttDflt Read/Write
CfgNetTuningIpReassTtl Read/Write
CfgNetTuningTcpSrttBase Read/Write
Legal Values Integer from 6 to Default 0x6 206
CfgNetTuningTcpMsl Read/Write
CfgNetTuningTcpReXmtMin Read/Write
CfgNetTuningTcpReXmtMax Read/Write
207
Where value is obtained from Table B-2
CfgNetTuningIpSubnetsAreLocal Read/Write
Tuning the Drac 4 for Satellite Connectivity
Ini files are used
CfgOobSnmp
CfgOobSnmpTrapsEnable Read/Write
Legal Values Boolean, either 1 or 0 True or False Default
CfgOobSnmpAgentCommunity Read/Write
Description =Disable, 1=Enable transmission of Snmp traps
CfgRacTuning
CfgOobSnmpAgentEnable Read/Write
CfgRacTuneHttpPort Read/Write
CfgRacTuneTelnetPort Read/Write
CfgRacTuneHttpsPort Read/Write
CfgRacTuneSshPort Read/Write
211
Legal Values 115200, 57600, 19200, Default 212
CfgRacTuneFwUpdateResetDelay Read/Write
CfgRacTuneRemoteRacadmEnable Read/Write
CfgRacTuneHostCom2BaudRate Read/Write
IfcRacMnOsHostname Read/Write
IfcRacManagedNodeOs
CfgRacTuneConRedirPort Read/Write
IfcRacMnOsOsName Read/Write
CfgRacSecCsrCommonName Read/Write
CfgRacSecurity
IfcRacMnOsOsType Read Only
CfgRacSecCsrOrganizationName Read/Write
CfgRacSecCsrStateName Read/Write
CfgRacSecCsrOrganizationUnit Read/Write
CfgRacSecCsrLocalityName Read/Write
CfgRacSecCsrKeySize Read/Write
CfgRacSecCsrCountryCode Read/Write
CfgRacSecCsrEmailAddr Read/Write
Description CSR state
CfgRacVirtual
CfgVirMediaDisable Read/Write
Legal Values Or 0 True or False Default Description
CfgFloppyEmulation Read/Write
CfgVirAtapiSrvPort Read/Write
CfgVirtualBootOnce Read/Write
CfgActiveDirectory
CfgADRacDomain Read/Write
CfgADRacName Read/Write
CfgADEnable Read/Write
CfgADAuthTimeout Read/Write
219
CfgADRootDomain Read/Write
Event Filter Operation and Event Mask Properties
Drac 4-Generated Event Mask Definitions
220
221
System-Generated Alert Mask Definitions
Racadm -g cfgTraps -o cfgTrapsFilterSysEventMask -i1
Miscmask
StatMask
Alert Filter Properties
222
SenMask
Alert Data Definitions
Alert Test Commands
Email Test Command
Racadm testemail -i index Racadm testemail -u username
Racadm testtrap -t -i trap index
Trap Test Command
Synopsis
224
Abbreviation for compact disc
Acronym for application programming interface
Other characters
Acronym for custom factory integration
Abbreviation for Domain Name System
Abbreviation for Dell Remote Access Controller
Abbreviation for Dynamic Domain Naming System
Abbreviation for disk storage unit
Abbreviation for light-emitting diode
Abbreviation for international standards organization
Abbreviation for local area network
Abbreviation for management information base
RAM disk
Abbreviation for remote access controller
Abbreviation for uninterruptible power supply
Acronym for system event log
229
Index
Drac 4, removing related applications and drivers
231
Index