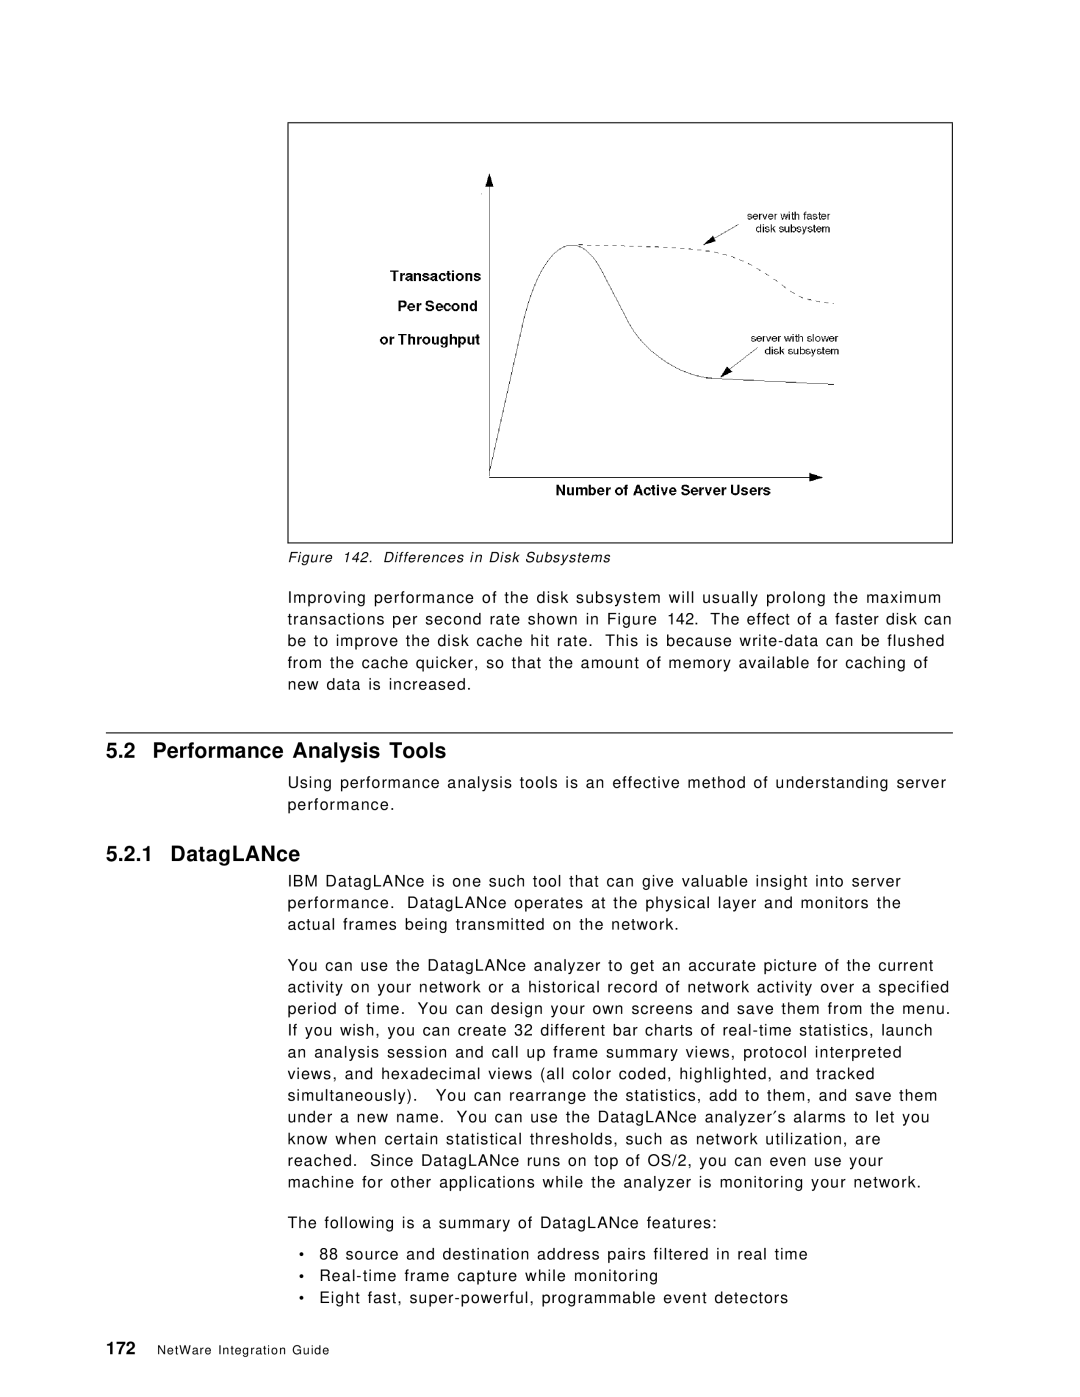
Figure 142. Differences in Disk Subsystems
Improving performance of the disk subsystem will usually prolong the maximum transactions per second rate shown in Figure 142. The effect of a faster disk can be to improve the disk cache hit rate. This is because
5.2 Performance Analysis Tools
Using performance analysis tools is an effective method of understanding server performance.
5.2.1 DatagLANce
IBM DatagLANce is one such tool that can give valuable insight into server performance. DatagLANce operates at the physical layer and monitors the actual frames being transmitted on the network.
You can use the DatagLANce analyzer to get an accurate picture of the current activity on your network or a historical record of network activity over a specified period of time. You can design your own screens and save them from the menu. If you wish, you can create 32 different bar charts of
The following is a summary of DatagLANce features:
∙
∙
∙
88 source and destination address pairs filtered in real time
Eight fast,