Observing Network Traffic
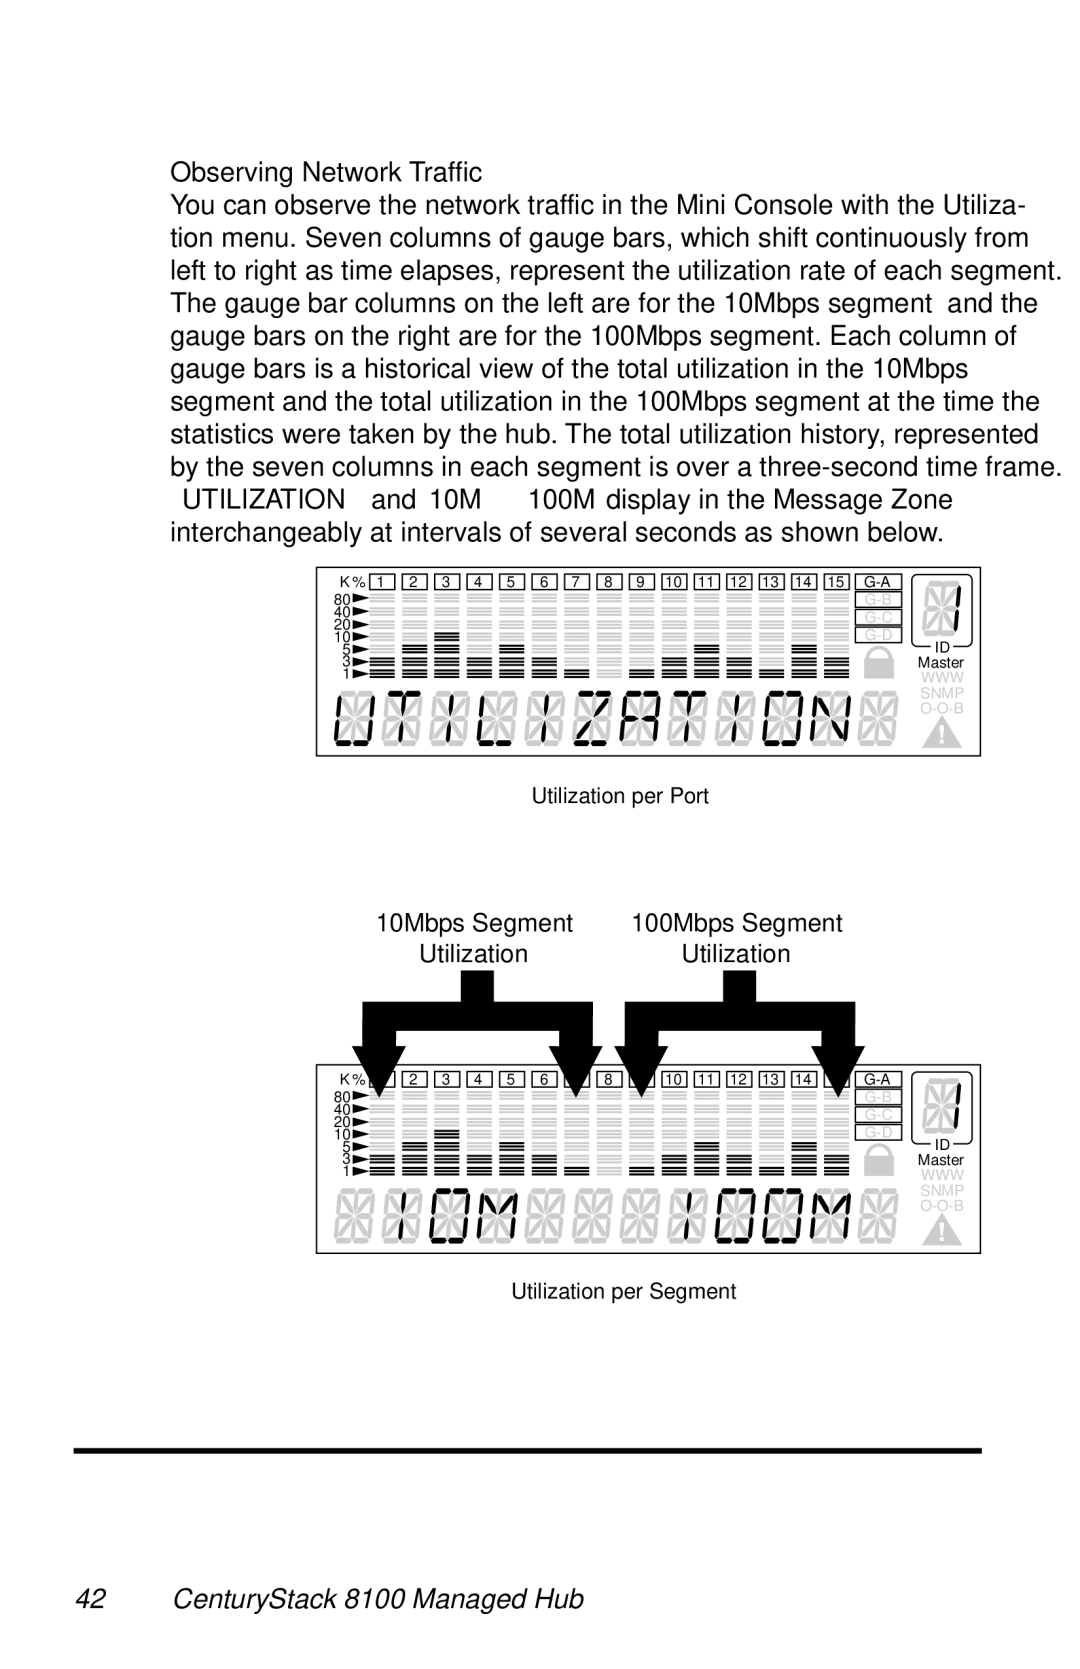
You can observe the network traffic in the Mini Console with the Utiliza- tion menu. Seven columns of gauge bars, which shift continuously from left to right as time elapses, represent the utilization rate of each segment. The gauge bar columns on the left are for the 10Mbps segment and the gauge bars on the right are for the 100Mbps segment. Each column of gauge bars is a historical view of the total utilization in the 10Mbps segment and the total utilization in the 100Mbps segment at the time the statistics were taken by the hub. The total utilization history, represented by the seven columns in each segment is over a
“UTILIZATION” and “10M 100M” display in the Message Zone interchangeably at intervals of several seconds as shown below.
K % 1 2 3 4 5 6 7 8 9 10 11 12 13 14 15 | ||
80 | ||
40 | ||
20 | ||
10 | ||
5 | ID | |
3 | Master | |
1 | WWW | |
| SNMP | |
| ||
Utilization per Port
10Mbps Segment | 100Mbps Segment |
Utilization | Utilization |
K % | 2 3 4 5 6 | 8 | 10 11 12 13 14 | |
80 |
|
|
| |
40 |
|
|
| |
20 |
|
|
| |
|
|
| ||
10 |
|
|
| |
5 |
|
|
| ID |
3 |
|
|
| Master |
1 |
|
|
| WWW |
|
|
|
| SNMP |
|
|
|
|
Utilization per Segment
